DASH/USD price analysis: Dash bulls looking to gather momentum to break above downward trending line
- DASH/USD went up from $81.10 to $81.50 in the early hours of Thursday, following a bearish Wednesday.
- The relative strength index (RSI) indicator is creeping close to the oversold zone.

DASH/USD has had a bullish start to Thursday as the price went up from $81.10 to $81.50. This Wednesday was heavily bearish for Dash as the price went down from $82.25 to $81.10. The hourly breakdown shows us that DASH/USD initially plummeted to $80.30, before bouncing up to $82.58. The price then dropped from $82.50 to $81 in just one hour, before correcting itself around $81.50.
DASH/USD daily chart
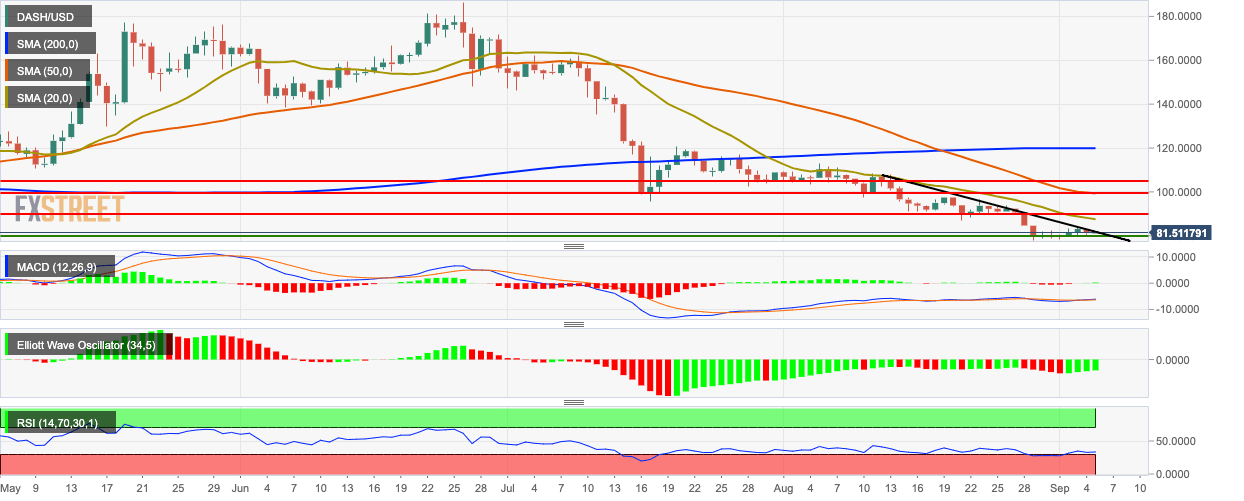
DASH/USD is currently negotiating with the resistance at the downward trending line. It is also trending below the 200-day simple moving average (SMA 200), SMA 50 and SMA 20 curves. The moving average convergence/divergence (MACD) indicator shows increasing bullish momentum and the Elliott oscillator shows three straight bullish sessions. The relative strength index (RSI) indicator is creeping close to the oversold zone.
Author

Rajarshi Mitra
Independent Analyst
Rajarshi entered the blockchain space in 2016. He is a blockchain researcher who has worked for Blockgeeks and has done research work for several ICOs. He gets regularly invited to give talks on the blockchain technology and cryptocurrencies.


