Curve DAO rallies as developer activity hits new ATH
- Curve DAO price extends its gains by 8% on Thursday, rallying over 15% so far this week.
- DefiLlama data shows that the CRV’s developer activity hit a new ATH, surpassing 900 commits per month.
- The technical outlook suggests a rally continuation as CRV’s long-to-short ratio points to increasing bullish bets among traders.

Curve DAO (CRV) price extends its gains by 8% and trades above $0.58 at the time of writing on Thursday, rallying over 15% so far this week. DefiLlama data shows that the CRV’s developer commits hit a new all-time high (ATH), surpassing 900 commits per month. The technical outlook suggests a rally continuation as CRV’s long-to-short ratio points to increasing bullish bets among traders.
Developer activity hit a new ATH
According to DefiLlama, a crypto aggregator for DeFi (Decentralized Finance), Curve DAO developer commits hit a new all-time high of 927, surpassing 900 monthly commits for the first time.
The high development activity on CRV reflects growing confidence in its blockchain projects, which boosts investor trust and reinforces positive market sentiment.
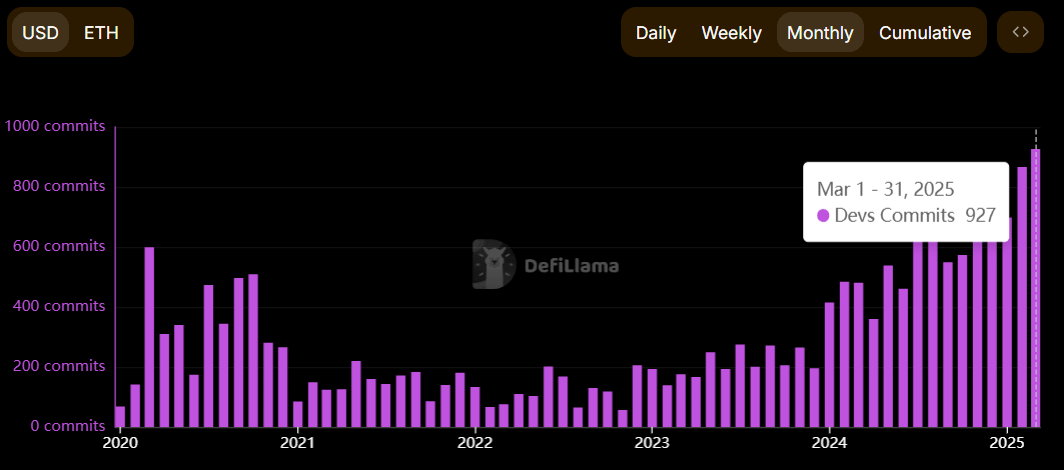
CRV developer commit chart. Source: DefiLlama
Another bullish sign is Coinglass’ CRV long-to-short ratio, which reads 1.10, the highest level in over a month. This ratio above one reflects bullish sentiment in the markets as more traders are betting for the asset price to rise.
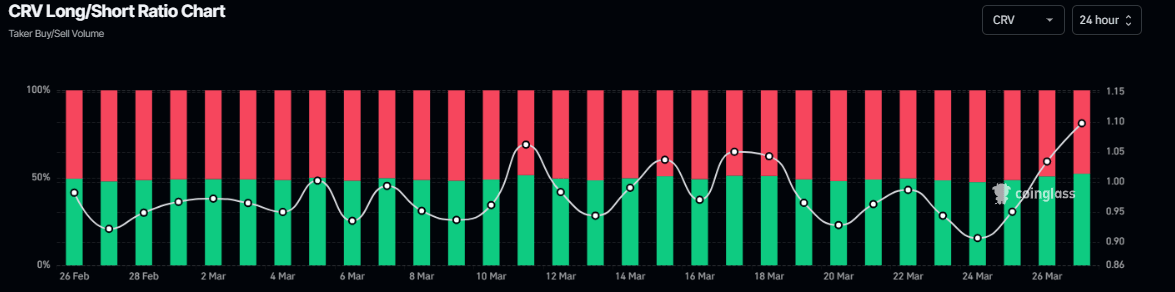
CRV long-to-short ratio chart. Source: Coinglass
Curve DAO Price Forecast: CRV bulls aim for the $0.69 mark
Curve DAO price broke above its 50-day Exponential Moving Average (EMA) at around $0.50 on Wednesday and rallied 9.47%. At the time of writing on Thursday, it continues to trade above $0.58, scoring 7% in daily gains.
If CRV continues the upward trend, it could extend the rally to retest its next daily resistance level at $0.69.
The Relative Strength Index (RSI) on the daily chart reads 68, above its neutral level of 50, indicating strong bullish momentum. The Moving Average Convergence Divergence (MACD) indicator on the daily chart also showed a bullish crossover, giving a buy signal and indicating an upward trend.
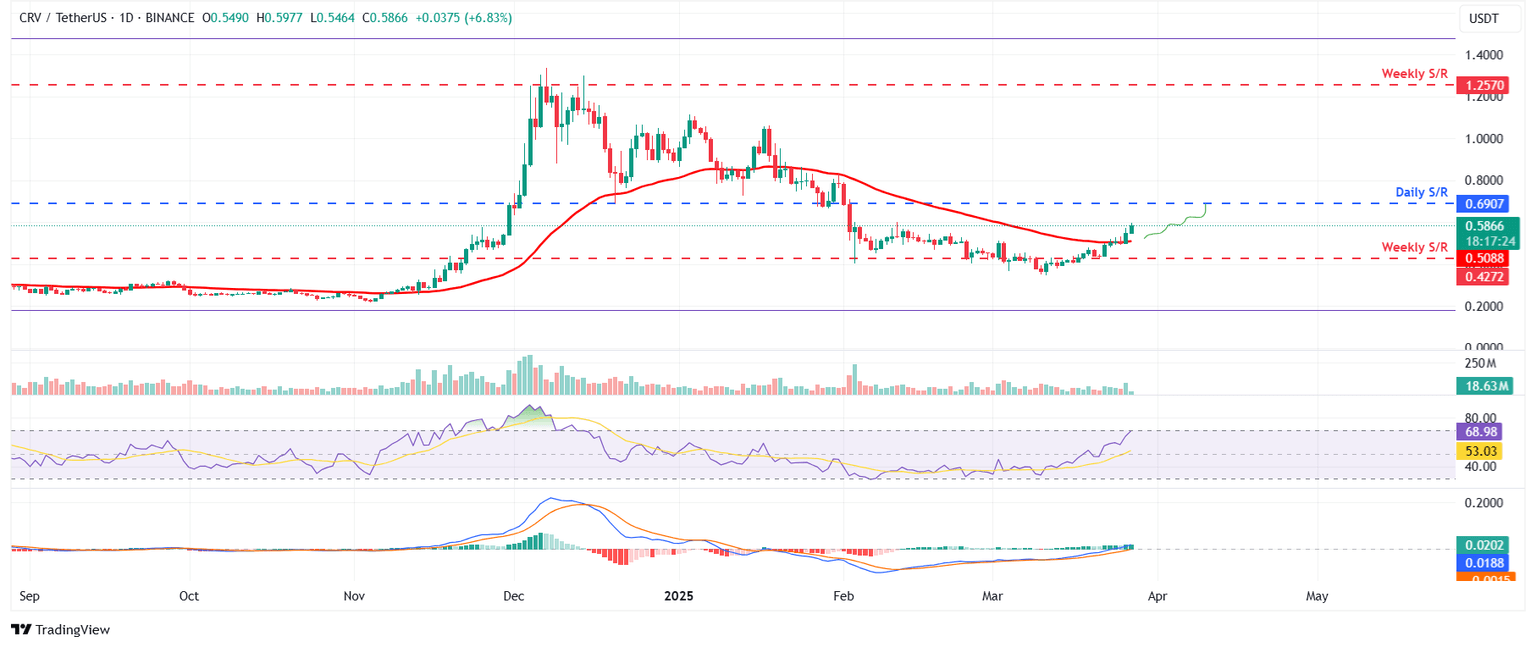
CRV/USDT daily chart
However, if CRV fails to find support around its 50-day EMA and closes below it, it could extend the decline to test its weekly support at $0.42.
Author

Manish Chhetri
FXStreet
Manish Chhetri is a crypto specialist with over four years of experience in the cryptocurrency industry.


