Cryptocurrency market update: What does the landscape look like post-halving?
- Bitcoin "Fear and Greed" has moved from Neutral to Fear, showing that investors are panicking post-halving.
- ETH/BTC bulls are in control for the second straight day.

Bitcoin Fear and Greed Index
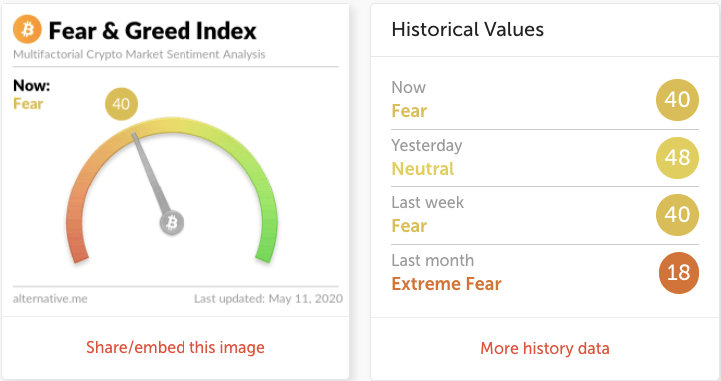
Alternative.me's Bitcoin fear and greed index has dropped from the “Neutral” to the “Fear” territory at 40. It looks like there is a bit of a panic among the investors post-halving.
ETH/BTC daily chart
-637248442355575914.png)
ETH/BTC bulls retained control for the second straight day as it went up from 0.021692 to 0.021715. This Monday, the bulls managed to take back ETH/BTC above the SMA 200. The MACD shows decreasing bearish momentum, while the RSI is trending at the edge of the oversold zone.
The bulls will need to conquer resistance at 0.02202 and 0.02252. On the downside, they will need to defend support levels at 0.0213 and 0.0207
BTC/USD daily chart
-637248442876671803.png)
BTC/USD went up from $8,672.65 to $8,591.58 as buyers try to take control post-halving. The price is trending above the red Ichimoku cloud. The Elliott Oscillator has had two red sessions in a row, while the MACD shows a reversal of bullish momentum. Both these indicators hint that the overall market sentiment is bearish.
On the downside, the buyers must defend the $8,390 and $8,125 support levels. On the upside, there are two strong resistance levels at $8,829.50 and $9,181.45.
ETH/USD daily chart
-637248444144519313.png)
ETH/USD went up from $185.82 to $186.42 as the buyers took control after four consecutive bearish days. The price is trending above the SMA 200 and SMA 50 curves, which are on the verge of crossing over to form the golden cross pattern.
The 20-day Bollinger jaw is narrowing, which shows decreasing price volatility. The William’s %R is still trending inside the oversold zone, indicating that the asset is undervalued and will go up more.
Bulls must aim for resistance levels at $196.70 and $207 to change market sentiment from bearish to bullish. On the downside, healthy support lies at $180.20 and $173.15.
XRP/USD daily chart
-637248444964991597.png)
XRP/USD bears stayed in control for the fourth straight day as the price went down from $0.1926 to $0.1917 in the early hours of Tuesday. The buyers face immediate resistance at the SMA 50 curve. The MACD shows increasing bearish momentum.
The bears will be aiming for the support levels at $0.1883 and $0.1812. On the upside, there are two strong resistance levels to be conquered at $0.1987 and $0.2115.
Author

Rajarshi Mitra
Independent Analyst
Rajarshi entered the blockchain space in 2016. He is a blockchain researcher who has worked for Blockgeeks and has done research work for several ICOs. He gets regularly invited to give talks on the blockchain technology and cryptocurrencies.


