- Bitcoin price breakout losses steam and settles for consolidation above $9,300.
- Elrond is arguably the best-performing cryptocurrency in 2020 after lifting from $0.00055 to $0.016 in three months.
Bitcoin finally broke out of the range it stuck in for several weeks. The sign of volatility in the cryptocurrency market and especially for Bitcoin was welcomed by traders with open arms. The motionless Bitcoin price action had driven investors to finding opportunities in altcoins such as Stellar, Cardano, Chainlink and Tezos.
The brief rally on Tuesday blasted past several barriers including $9,300 and $9,400. However, gains became unsustainable towards $9,500. Instead, BTC/USD lost some of the ground gained, making a comeback into the $9,300 range. At the moment, Bitcoin is exchanging hands at $9,337 while facing increasing selling activity at the 50-day SMA. On the downside, support has been established at $9,300. Consolidation is expected to continue taking place in the coming sessions.
Selected altcoins skyrocketing
Although Bitcoin was the main force behind the breakouts experienced across the crypto market on Tuesday, it has stalled while some selected altcoins continue to spike. Some of these altcoins include Augur, Elrond, Terra and Kava.
Elrond market update
In the last 24 hours, Elrond has added over 25% to its value. The cryptocurrency has been on a constant surge since the beginning of the year. It is one of the altcoins that are taking attention away from Bitcoin. The crypto’s website claims to be having the capacity for higher scalability as well as a high transaction rate per second. Before the end of July, the network will launch its mainnet; an event that is expected to keep Elrond in the spotlight.
It is clear that the mainnet launch is not the main factor behind Elrond’s 3,000% rally in about three months. Note that the token broke down to an all-time low in March at $0.00055. Although recovery across the market has been drab for most assets especially Bitcoin, Elrond’s rally has been impressive with gains hitting levels above $0.016 this July.
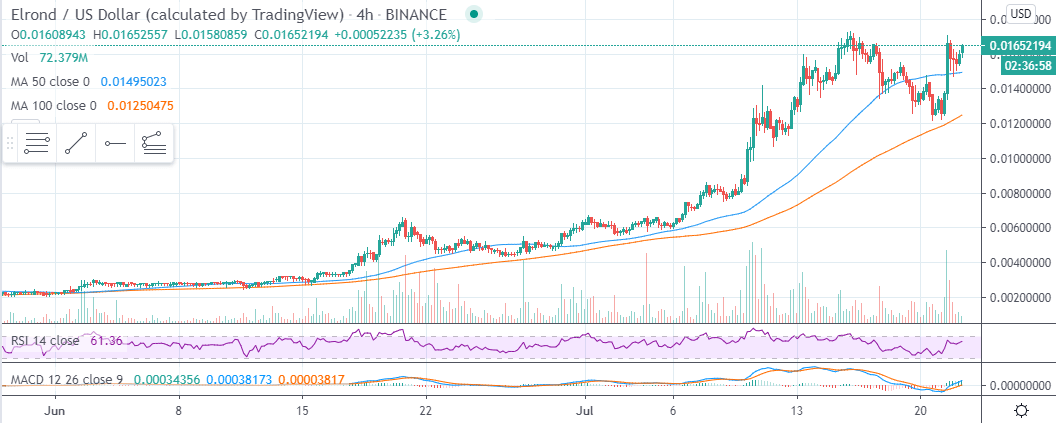
At the time of writing, ERD is trading at $0.016. Another breakout seems to be brewing with the RSI and MACD pointing upwards. On the downside, the first formidable support is the 50 SMA at $0.0149. Other key support areas include $0.014, the 100 SMA at $0.01250 and the primary support at $0.012.
ERD/USD 4-hour chart
Information on these pages contains forward-looking statements that involve risks and uncertainties. Markets and instruments profiled on this page are for informational purposes only and should not in any way come across as a recommendation to buy or sell in these assets. You should do your own thorough research before making any investment decisions. FXStreet does not in any way guarantee that this information is free from mistakes, errors, or material misstatements. It also does not guarantee that this information is of a timely nature. Investing in Open Markets involves a great deal of risk, including the loss of all or a portion of your investment, as well as emotional distress. All risks, losses and costs associated with investing, including total loss of principal, are your responsibility. The views and opinions expressed in this article are those of the authors and do not necessarily reflect the official policy or position of FXStreet nor its advertisers. The author will not be held responsible for information that is found at the end of links posted on this page.
If not otherwise explicitly mentioned in the body of the article, at the time of writing, the author has no position in any stock mentioned in this article and no business relationship with any company mentioned. The author has not received compensation for writing this article, other than from FXStreet.
FXStreet and the author do not provide personalized recommendations. The author makes no representations as to the accuracy, completeness, or suitability of this information. FXStreet and the author will not be liable for any errors, omissions or any losses, injuries or damages arising from this information and its display or use. Errors and omissions excepted.
The author and FXStreet are not registered investment advisors and nothing in this article is intended to be investment advice.
Recommended Content
Editors’ Picks
Ripple's move above this key level could trigger nearly 50% rally for XRP
Ripple has overcome a critical resistance level and flipped into a support floor on the weekly time frame. This development happened while XRP tightly consolidated for roughly 250 days. Investors can expect XRP to kickstart a massive rally.
Optimism price outlook with nearly $90 million worth of OP tokens flooding markets on Friday
Optimism volatility has shrunk in the ours leading to the network’s cliff unlock. It joins the likes of dYdX and Sui, which have similar events on their calendars. As token unlocks are often considered bearish catalysts, investors should brace for a reaction after the event.
Top 3 Price Prediction Bitcoin, Ethereum, Ripple: Retail watches from the sidelines with a bias for shorts
Bitcoin could clear $73,777 peak as BTC bulls resurface. Ethereum might fall 10% before next leg up as ETH RSI teases with sell signal. XRP could lose $0.6000 threshold as Ripple bulls fail to show up.
Jito price could hit $6 as JTO coils up inside this bullish pattern
Jito price action shows a potential cup and handle formation. Based on theoretical measurement rules, a successful breakout could yield a 56% rally to $6.0. A breakdown of the $3.86 support level would create a lower low for JTO and invalidate the bullish thesis.
Bitcoin: BTC may have recovered, but is it out of the woods?
Bitcoin’s (BTC) upward momentum has shown a significant decline for the past two weeks or so. This development led to a bearish signal on the weekly and an uncertain outlook on the monthly.