Cryptocurrency Market Update: BTC/USD moves from “Fear” to “Greed” for the first time since February 19, 2020, as the market jumps up pre-halving
- ETH/BTC had a bullish session following six straight bearish days.
- BTC/USD is consolidating itself above the $10,000 level.

Bitcoin Fear & Greed Index
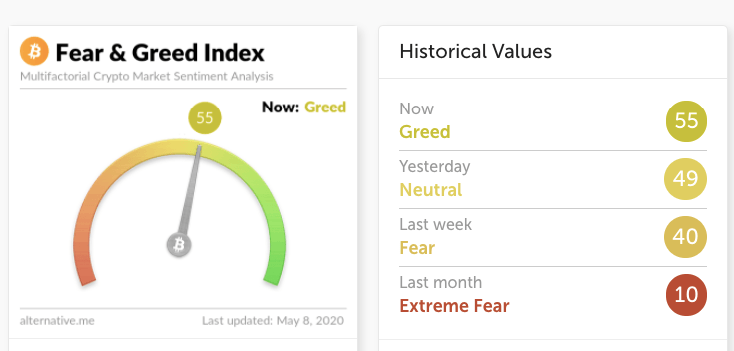
Alternative.me’s Fear & Greed Index has finally moved into the “greed” zone for the first time since February 19, 2020 as it trends around 55. The bulls are busy consolidating their positions pre-halving. It won’t be surprising to see the price move into the “Extreme Greed” zone over the next four days.
ETH/BTC daily chart
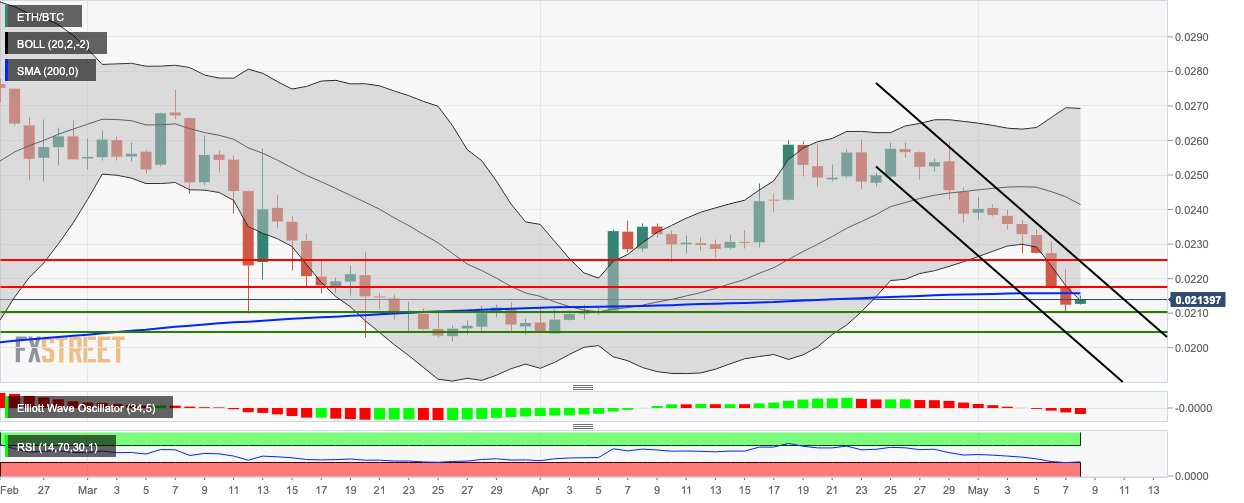
ETH/BTC had a bullish start to the day as it went up from 0.0212 to 0.0215, re-entering the 20-day Bollinger Band. Before this, ETH/BTC daily chart had six consecutive bearish sessions. This Thursday, the asset dropped from 0.02176 to 0.0212 and broke below the SMA 200, in the process. The latter is currently acting as an immediate market resistance. Along with the SMA 200 curve, other key resistance levels to overcome lie at 0.02176 and 0.0225. On the downside, healthy support levels lie at 0.02103 and 0.0205. The RSI has dipped into the oversold territory, suggesting that more bullish action can be expected today. The Elliott Oscillator has plummeted from 0.002313 to -0.001678 over the last 12 sessions.
BTC/USD daily chart
-637244996171915467.png)
After a brief bearish start, BTC/USD promptly went up from $10,000 to $10,009.40 in the early hours of Friday. This Thursday, the bulls showed their hand as the price climbed from $9,158.30 to $10,000. The RSI indicator is trending around 78 within the overbought zone, suggesting that the price is currently overvalued and a short-term bearish correction is expected. The MACD indicates that overall market momentum is bullish.
ETH/USD daily chart
-637244996859632904.png)
ETH/USD continues to be sandwiched between the upward trending line and the red Ichimoku cloud. This Thursday, the price bounced off the trending line and jumped from 199.25 to $212.41. The bulls have taken the price up further to $215.25 in the early hours of Friday. The SMA 50 is looking to crossover the SMA 200 to potentially chart the golden cross pattern. The MACD indicates decreasing bullish momentum, while the Elliott Oscillator has had four straight red sessions. The bulls need to conquer the $223.30 resistance line to enter the Ichimoku cloud, following which, they must take care of the $232.15 line. On the downside, healthy support levels lie at $207 and $197.50.
XRP/USD daily chart
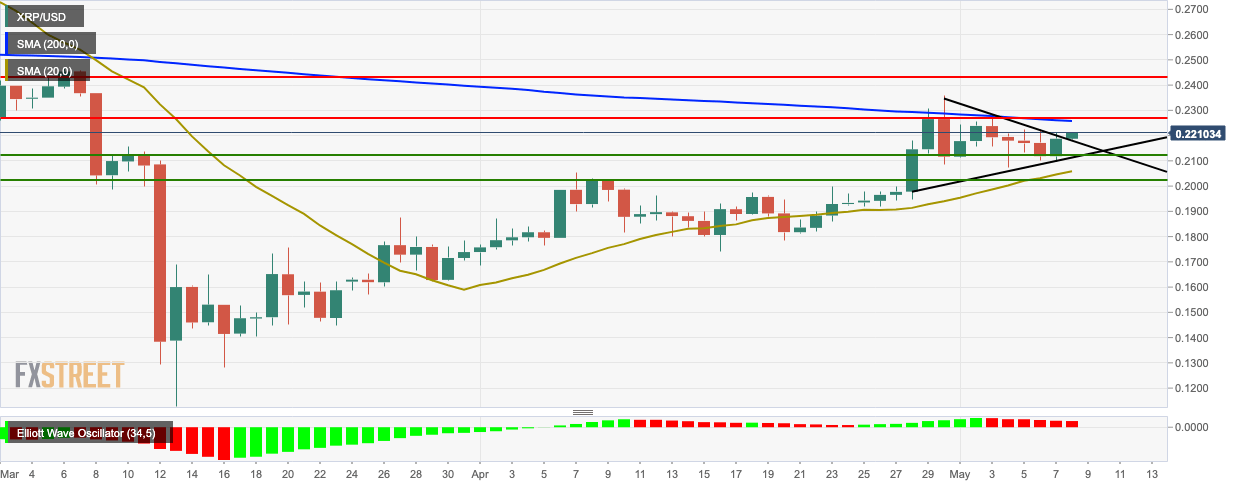
XRP/USD bulls remained in control as the price rose up from $0.2187 to $0.2195 in the early horse of Friday, breaking above the triangle formation in the process. The bulls are now going to aim for the $0.2272 resistance line to break above the SMA 200 curve. After this, they’ll want to gather enough momentum to hit the $0.2435 resistance line. On the downside, support lies at $0.212 and $0.2023. The Elliott Oscillator has had six consecutive red sessions.
Author

Rajarshi Mitra
Independent Analyst
Rajarshi entered the blockchain space in 2016. He is a blockchain researcher who has worked for Blockgeeks and has done research work for several ICOs. He gets regularly invited to give talks on the blockchain technology and cryptocurrencies.


