Crypto.com price may blast through resistance to hit $0.60
- Crypto.com price maintains a strong drive higher, showing significant and sustained buying pressure.
- Bulls appear unfazed as CRO gets closer to the critical $0.50 resistance level.
- Weekly oscillators support a continued push beyond $0.50 if buyers can keep up the pressure.

Crypto.com price is approaching the most important psychological price level: the $0.50 level on its daily chart. While $0.50 is an important price level, there is not much in the form of technical resistance at $0.50. The next major resistance zone doesn’t appear until $0.60, so CRO may likely continue to move higher without much pressure.
Crypto.com price prepares for a big breakout above $0.50
Crypto.com price recently completed a very bullish event by converting the Relative Strength Index from bear market conditions to bull market conditions on the daily chart. The conversion of the daily Relative Strength Index from bear market conditions (overbought at 55 and 65, oversold at 20 and 30) to bull market conditions (overbought at 80 and 90, oversold at 40 and 50) when it hit the 70 level. As a result, and pullback to the Tenkan-Sen or Kijun-Sen on the daily chart will likely find support if the Relative Strength Index is trading near 40 or 50.
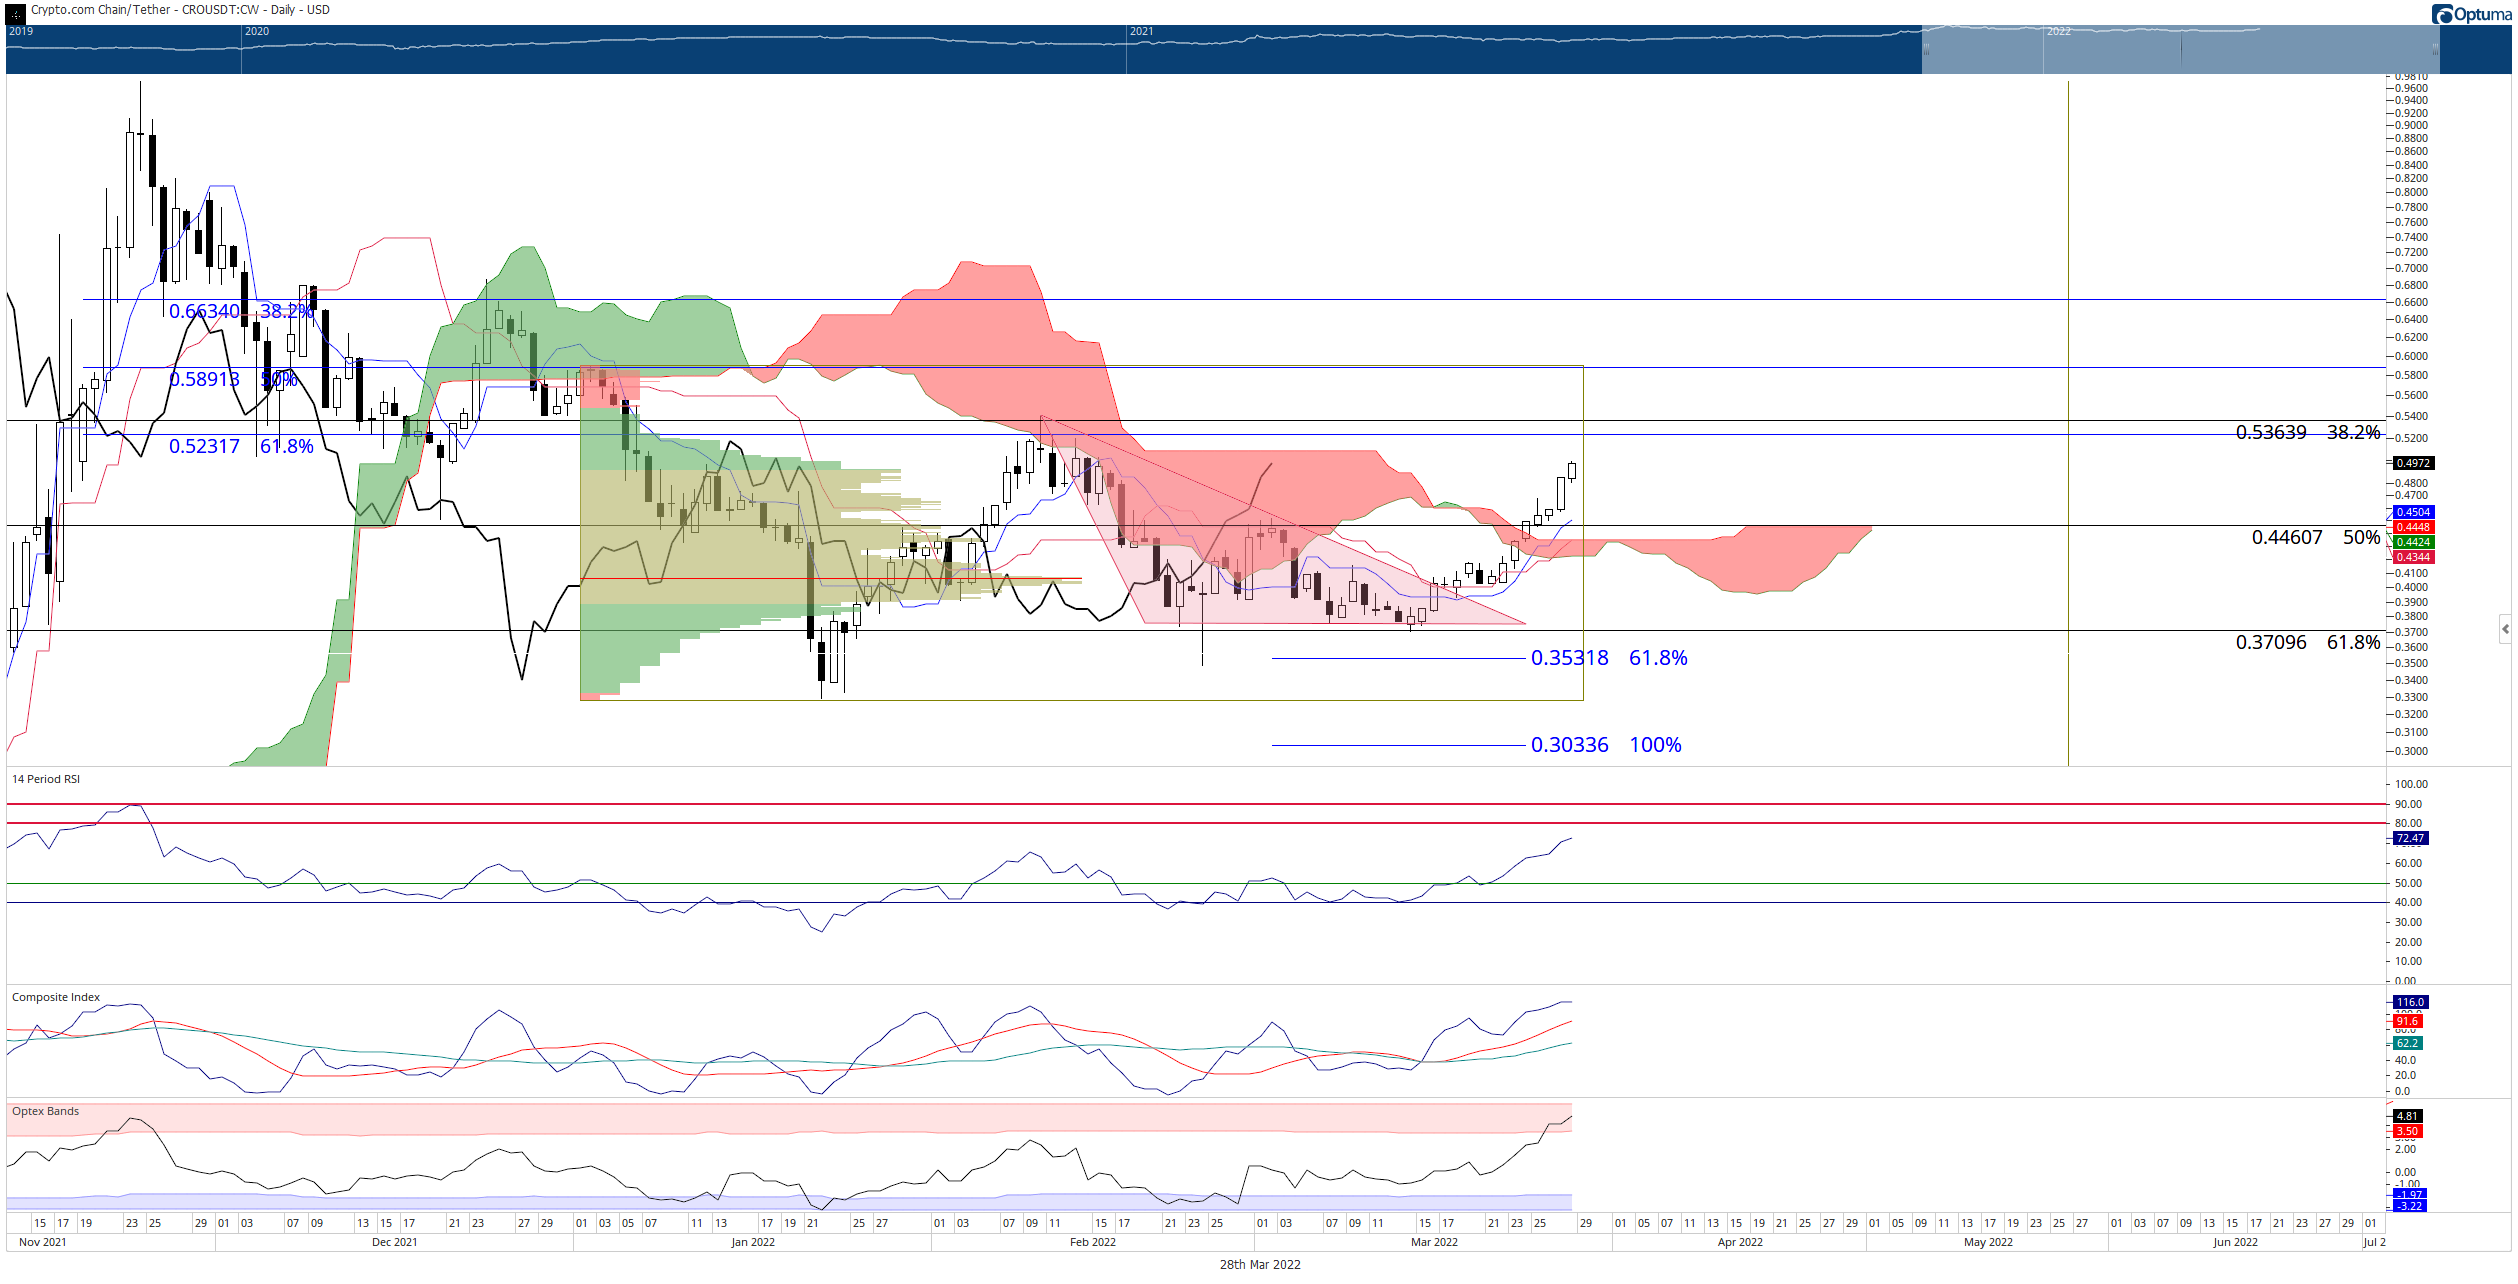
CRO/USDT Daily Ichimoku Kinko Hyo Chart
Crypto.com price may find some selling pressure near the 38.2% Fibonacci retracement of the all-time high to the low of the strong bar on the monthly chart in November 2021 at $0.54. In addition, if the Relative Strength Index is above 80, then the likelihood of some selling pressure increases. However, an imminent pullback is not a foregone conclusion. CRO’s weekly chart shows why traders could see continued movement.
Last week’s close for Crypto.com price was above the Tenkan-Sen was the first since the week of December 24, 2021 – a very strong bullish signal for either a corrective move or a broader trend change. From an oscillator perspective, the Optex Bands oscillator is just turning up from all-time lows.
Likewise, the weekly Relative Strength Index bounced off the first oversold level in a bull market, 40. Finally, the Composite Index crossed above its slow-moving average, generating another strong bullish signal.
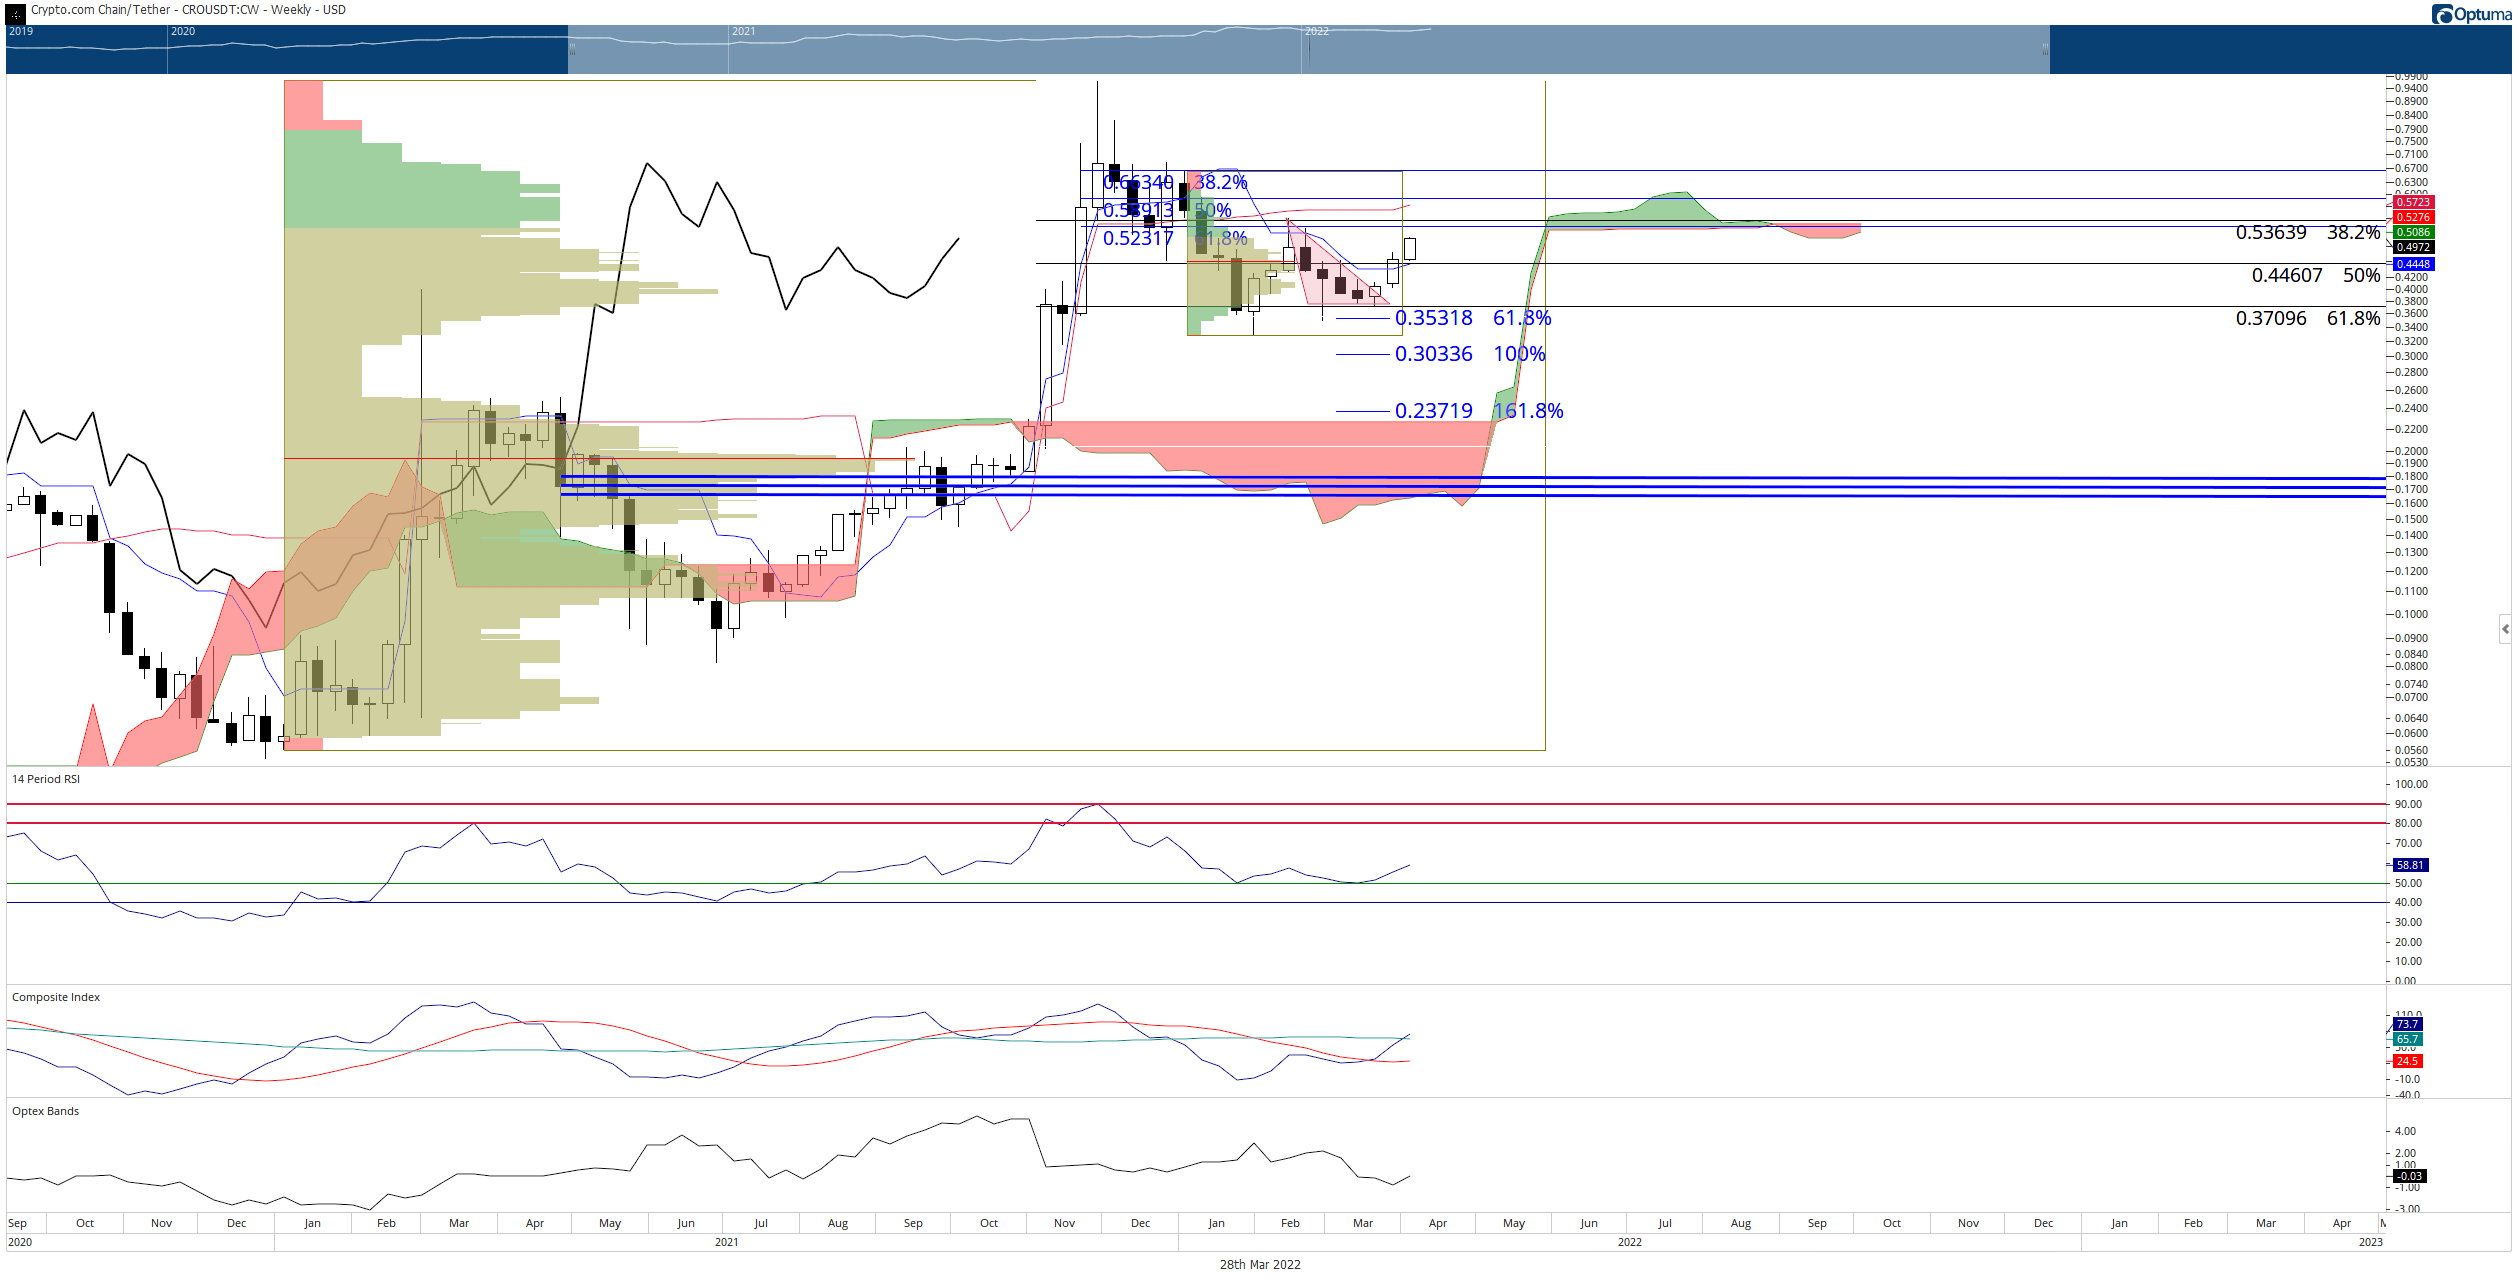
CRO/USDT Weekly Ichimoku Kinko Hyo Chart
If bulls maintain a strong drive without a pullback, then Crypto.com price may continue until it hits the 50% Fibonacci retracement at $0.59, near the weekly Kijun-Sen at $0.58.
Author

Jonathan Morgan
Independent Analyst
Jonathan has been working as an Independent future, forex, and cryptocurrency trader and analyst for 8 years. He also has been writing for the past 5 years.



