Crypto Market Gainers: PENDLE, MNT, AERO flip bullish with double-double gains
- Pendle posts over 25% gains in the last 24 hours, leading the crypto market recovery.
- Mantle reclaims the $1.00 level and is aiming for further gains amid a golden cross.
- Aerodrome Finance token bounces off within a rising channel, with bulls targeting $1.00.

The cryptocurrency market is back in the green with the US President Trump signing the Crypto 401k executive order. Pendle (PENDLE), Mantle (MNT), and Aerodrome Finance (AERO) are leading the gains over the last 24 hours. The technical outlook indicates a potential momentum shift in the PENDLE, MNT, and AERO altcoins, suggesting further growth as buying pressure builds.
Bullish run in PENDLE nears the annual high
Pendle edges higher by over 2% at press time on Friday, extending the 25% surge from Thursday. The recovery run hits the highest price since January 7, targeting the year-to-date high of $5.59.
The Moving Average Convergence Divergence (MACD) line crosses above its signal line, flashing a buy signal as bullish momentum resurfaces. The Relative Strength Index (RSI) stands at 66 on the daily chart, rising towards the overbought zone, which indicates heightened buying pressure.
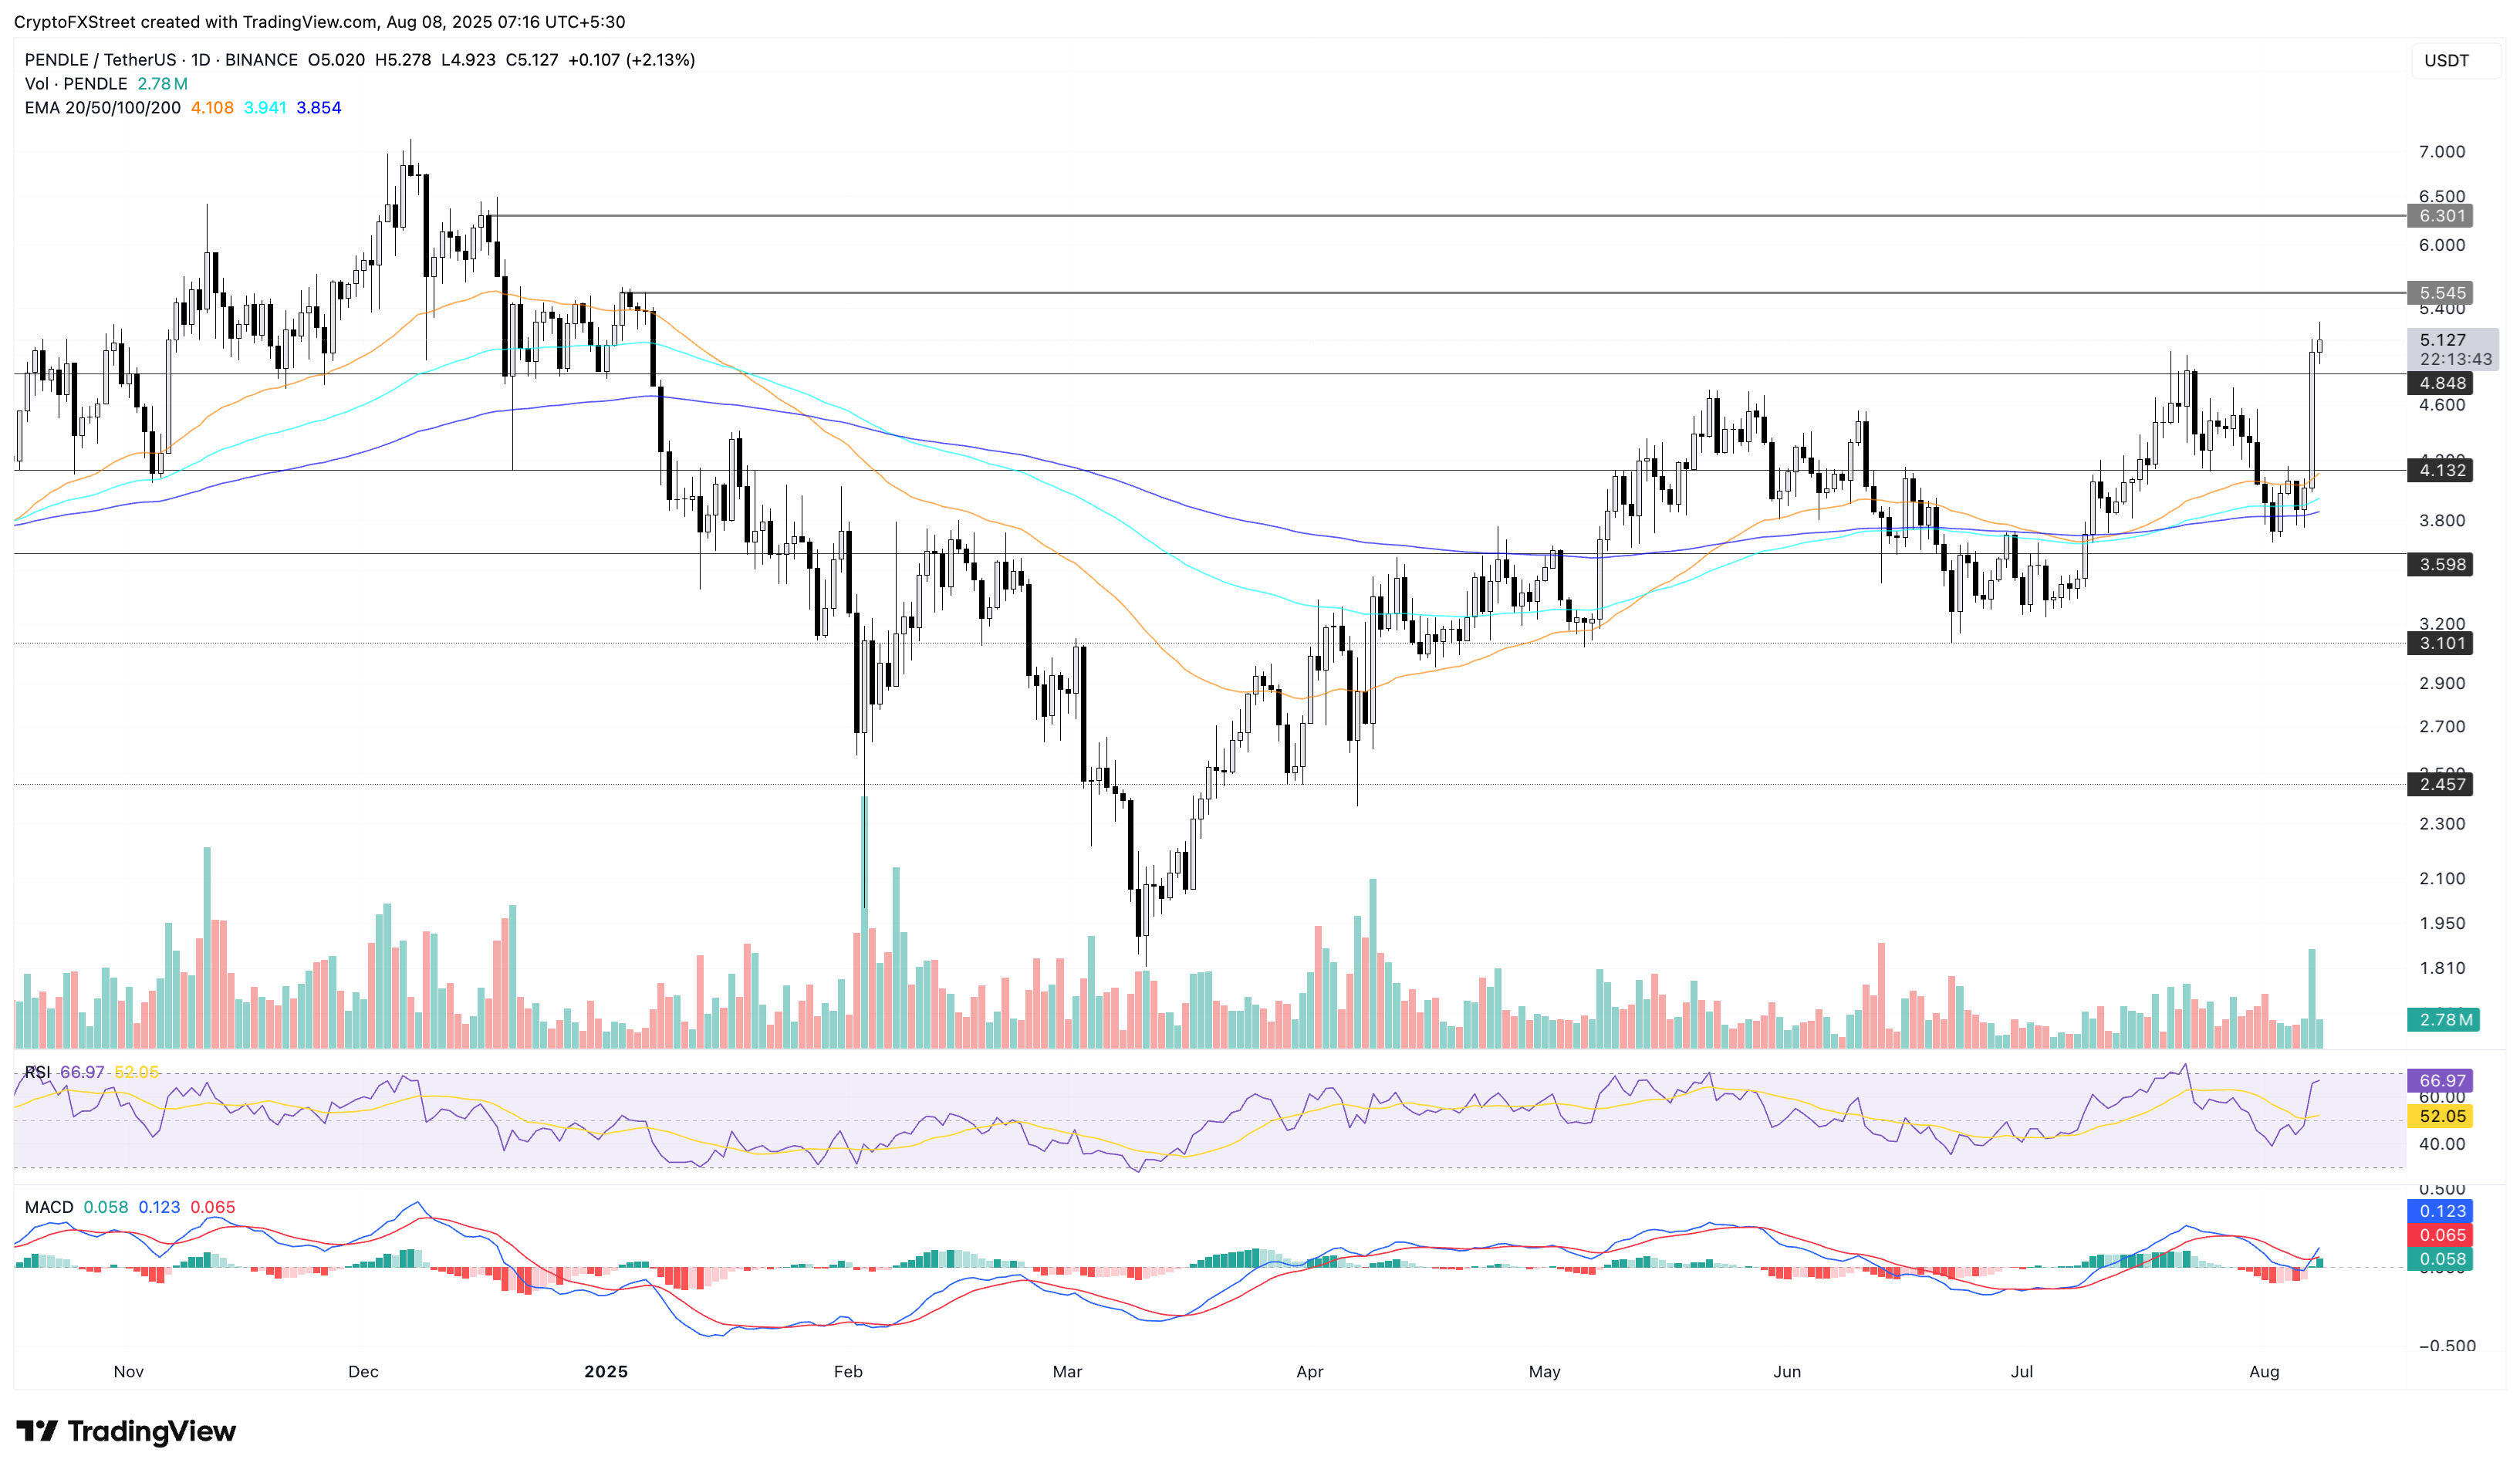
PENDLE/USDT daily price chart.
On the flipside, a reversal below the $4.84 level would invalidate the bullish rally, risking a potential retest of the 50-day Exponential Moving Average (EMA) at $4.10.
MNT wedge breakout rally seems unstoppable, targets $1.41
Mantle’s wedge breakout rally gains traction, nearing the 78.6% Fibonacci level at $1.16, which is drawn from the $1.41 peak on January 6 to $0.55 low on July 1. At the time of writing, MNT appreciates over 4% on the day after the 20% jump on Thursday.
MNT could extend the recovery run with a decisive close above the $1.16 level, potentially targeting the $1.41 peak.
The MACD and its signal line flashed a buy signal on Tuesday with a fresh wave of green histogram bars. Furthermore, the RSI stands at 76, indicating a move higher into the overbought zone, which suggests increasing buying pressure.
The 50-day EMA inches closer to the 200-day EMA for a Golden Cross after surpassing the 100-day EMA, indicating a rapid surge in the short-term bullish trend.
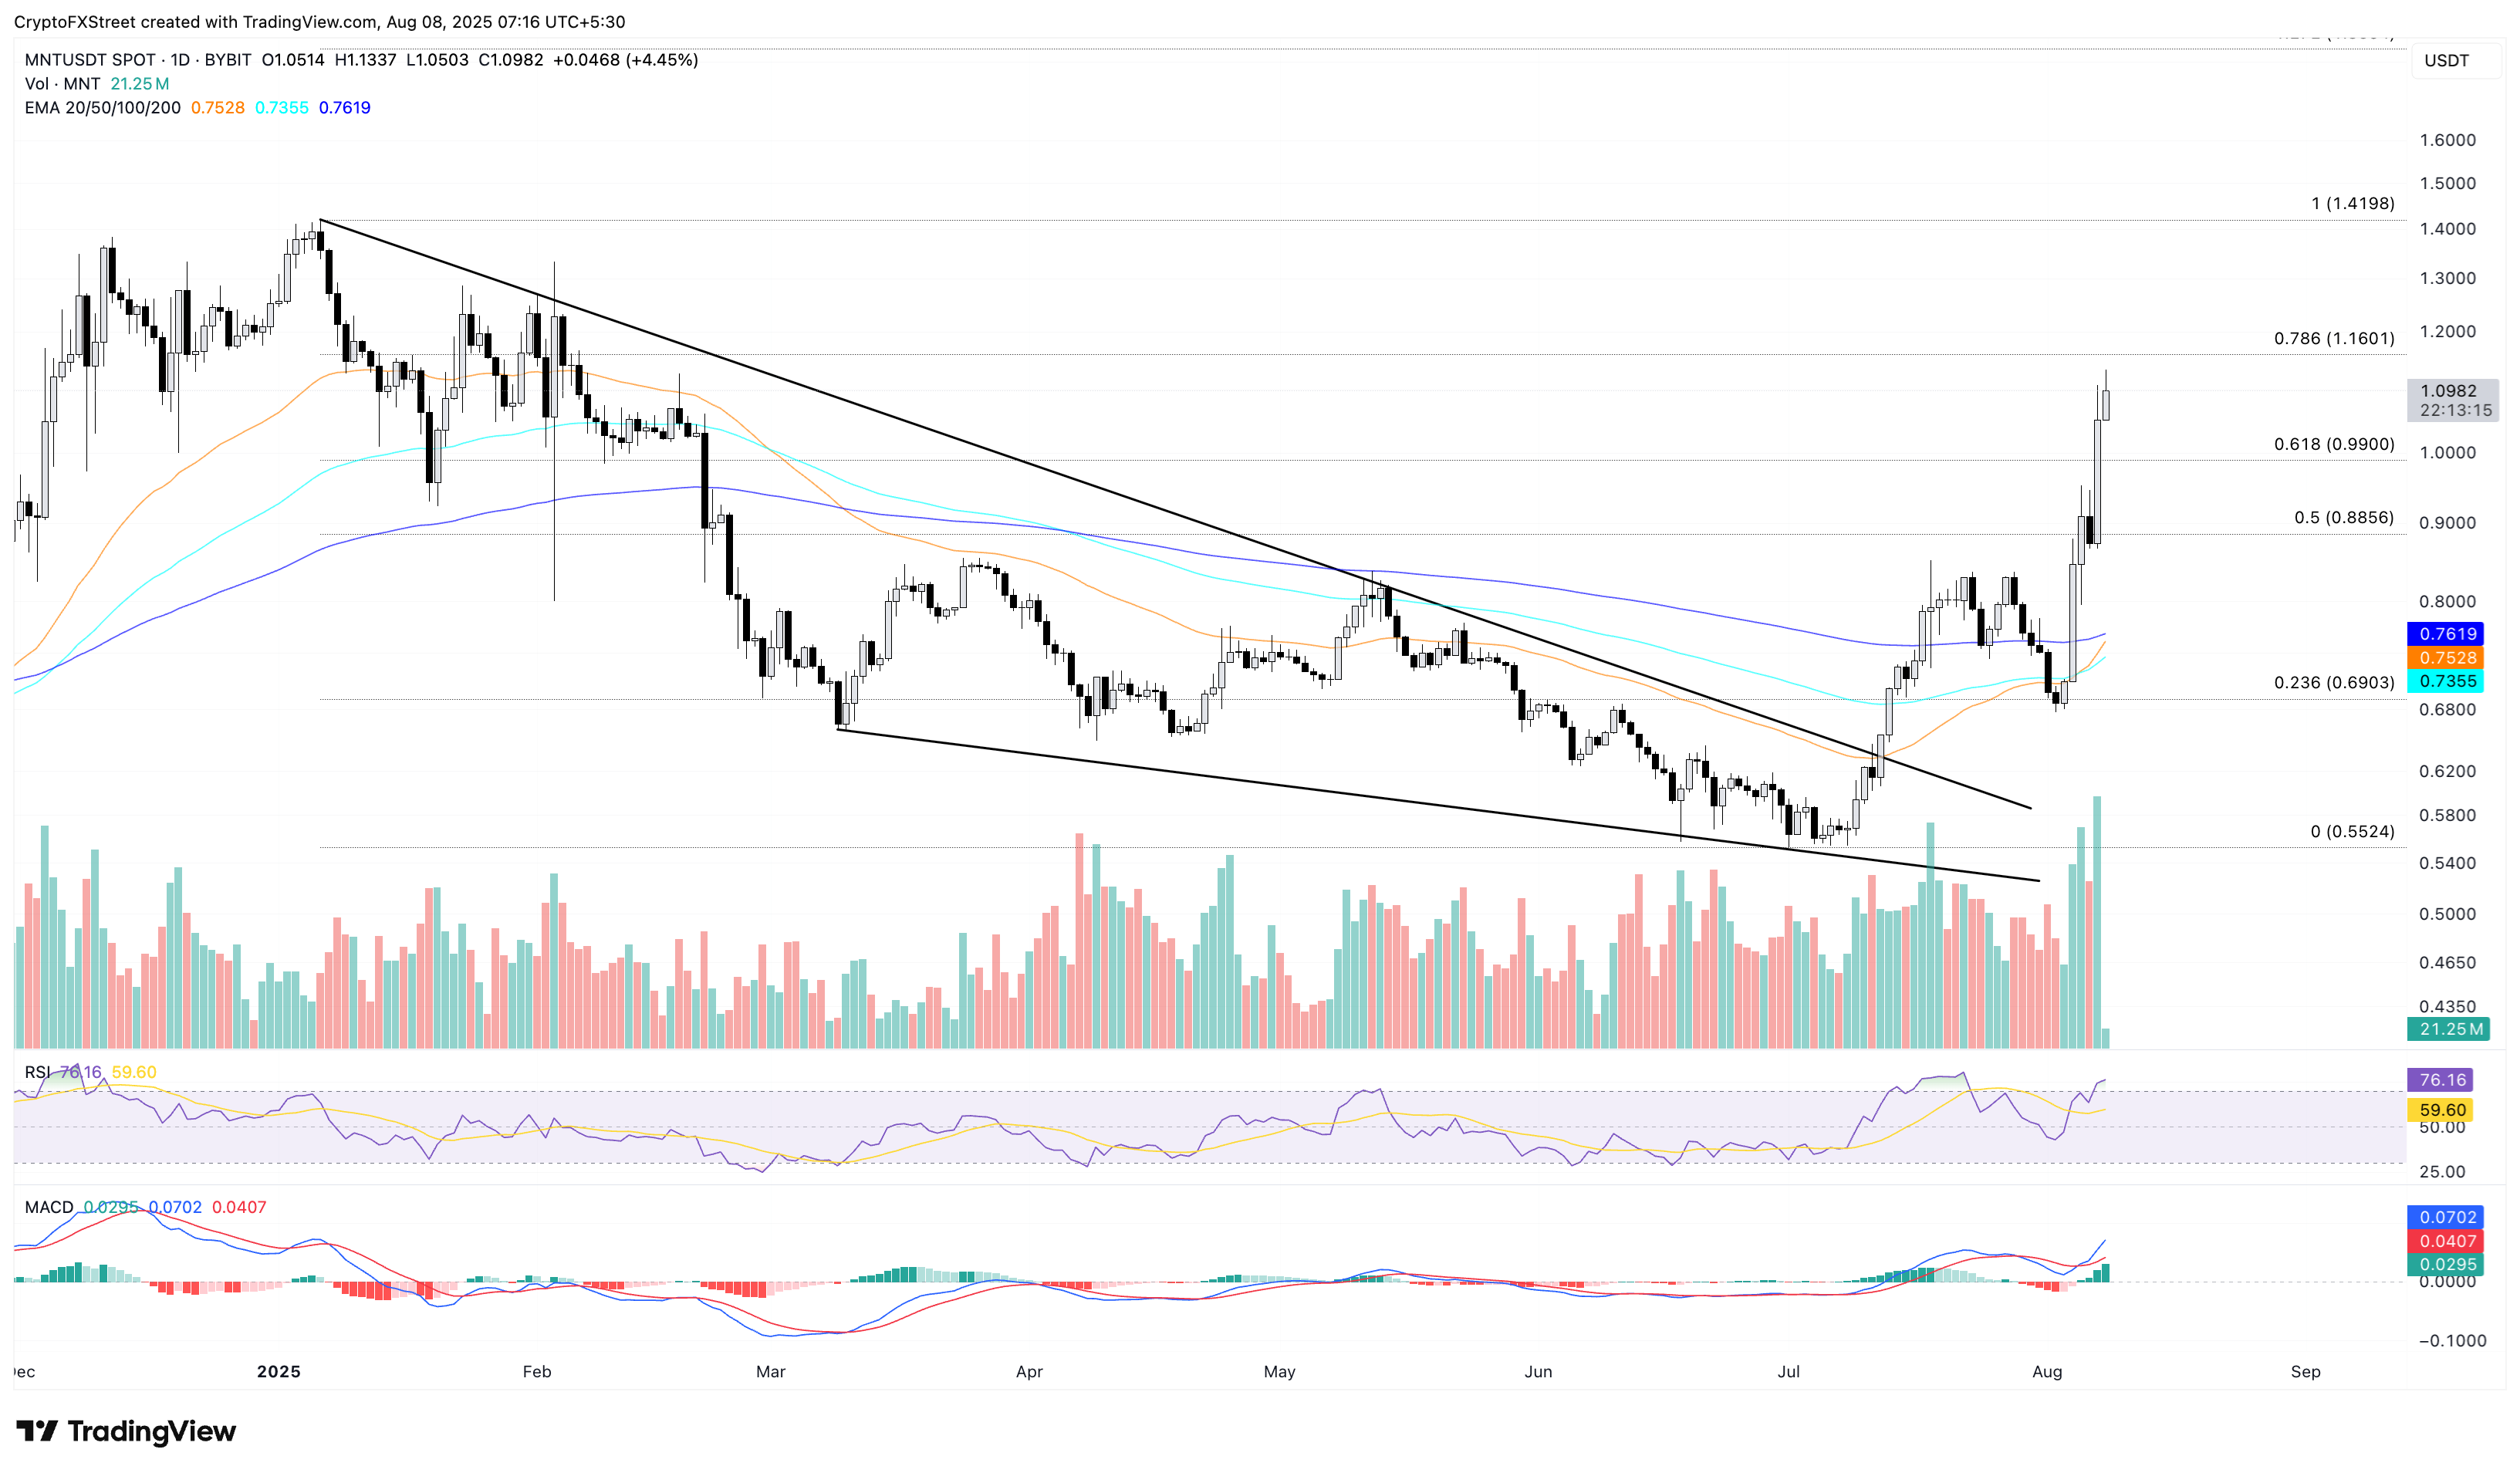
MNT/USDT daily price chart.
On the contrary, a reversal from the $1.16 level could retest the 61.8% Fibonacci level at $0.99.
AERO flashes bullish potential within a rising channel, targeting $1
Aerodrome Finance’s AERO token maintains its ground at press time on Friday, following the 15% jump on Thursday. AERO’s recovery marks a new positive cycle within a rising channel pattern marked on the daily chart (shared below).
The recent bounce back has surpassed the 50% retracement level at $0.81, which is drawn from $2.33 on December 12 to $0.28 on April 7, and is now targeting the 61.8% Fibonacci level at $1.04.
The RSI reads 56 on the same chart, crossing above the neutral level as buying pressure increases. Moreover, the MACD line is on the verge of surpassing its signal line, indicating a potential buying opportunity as bullish momentum revives.
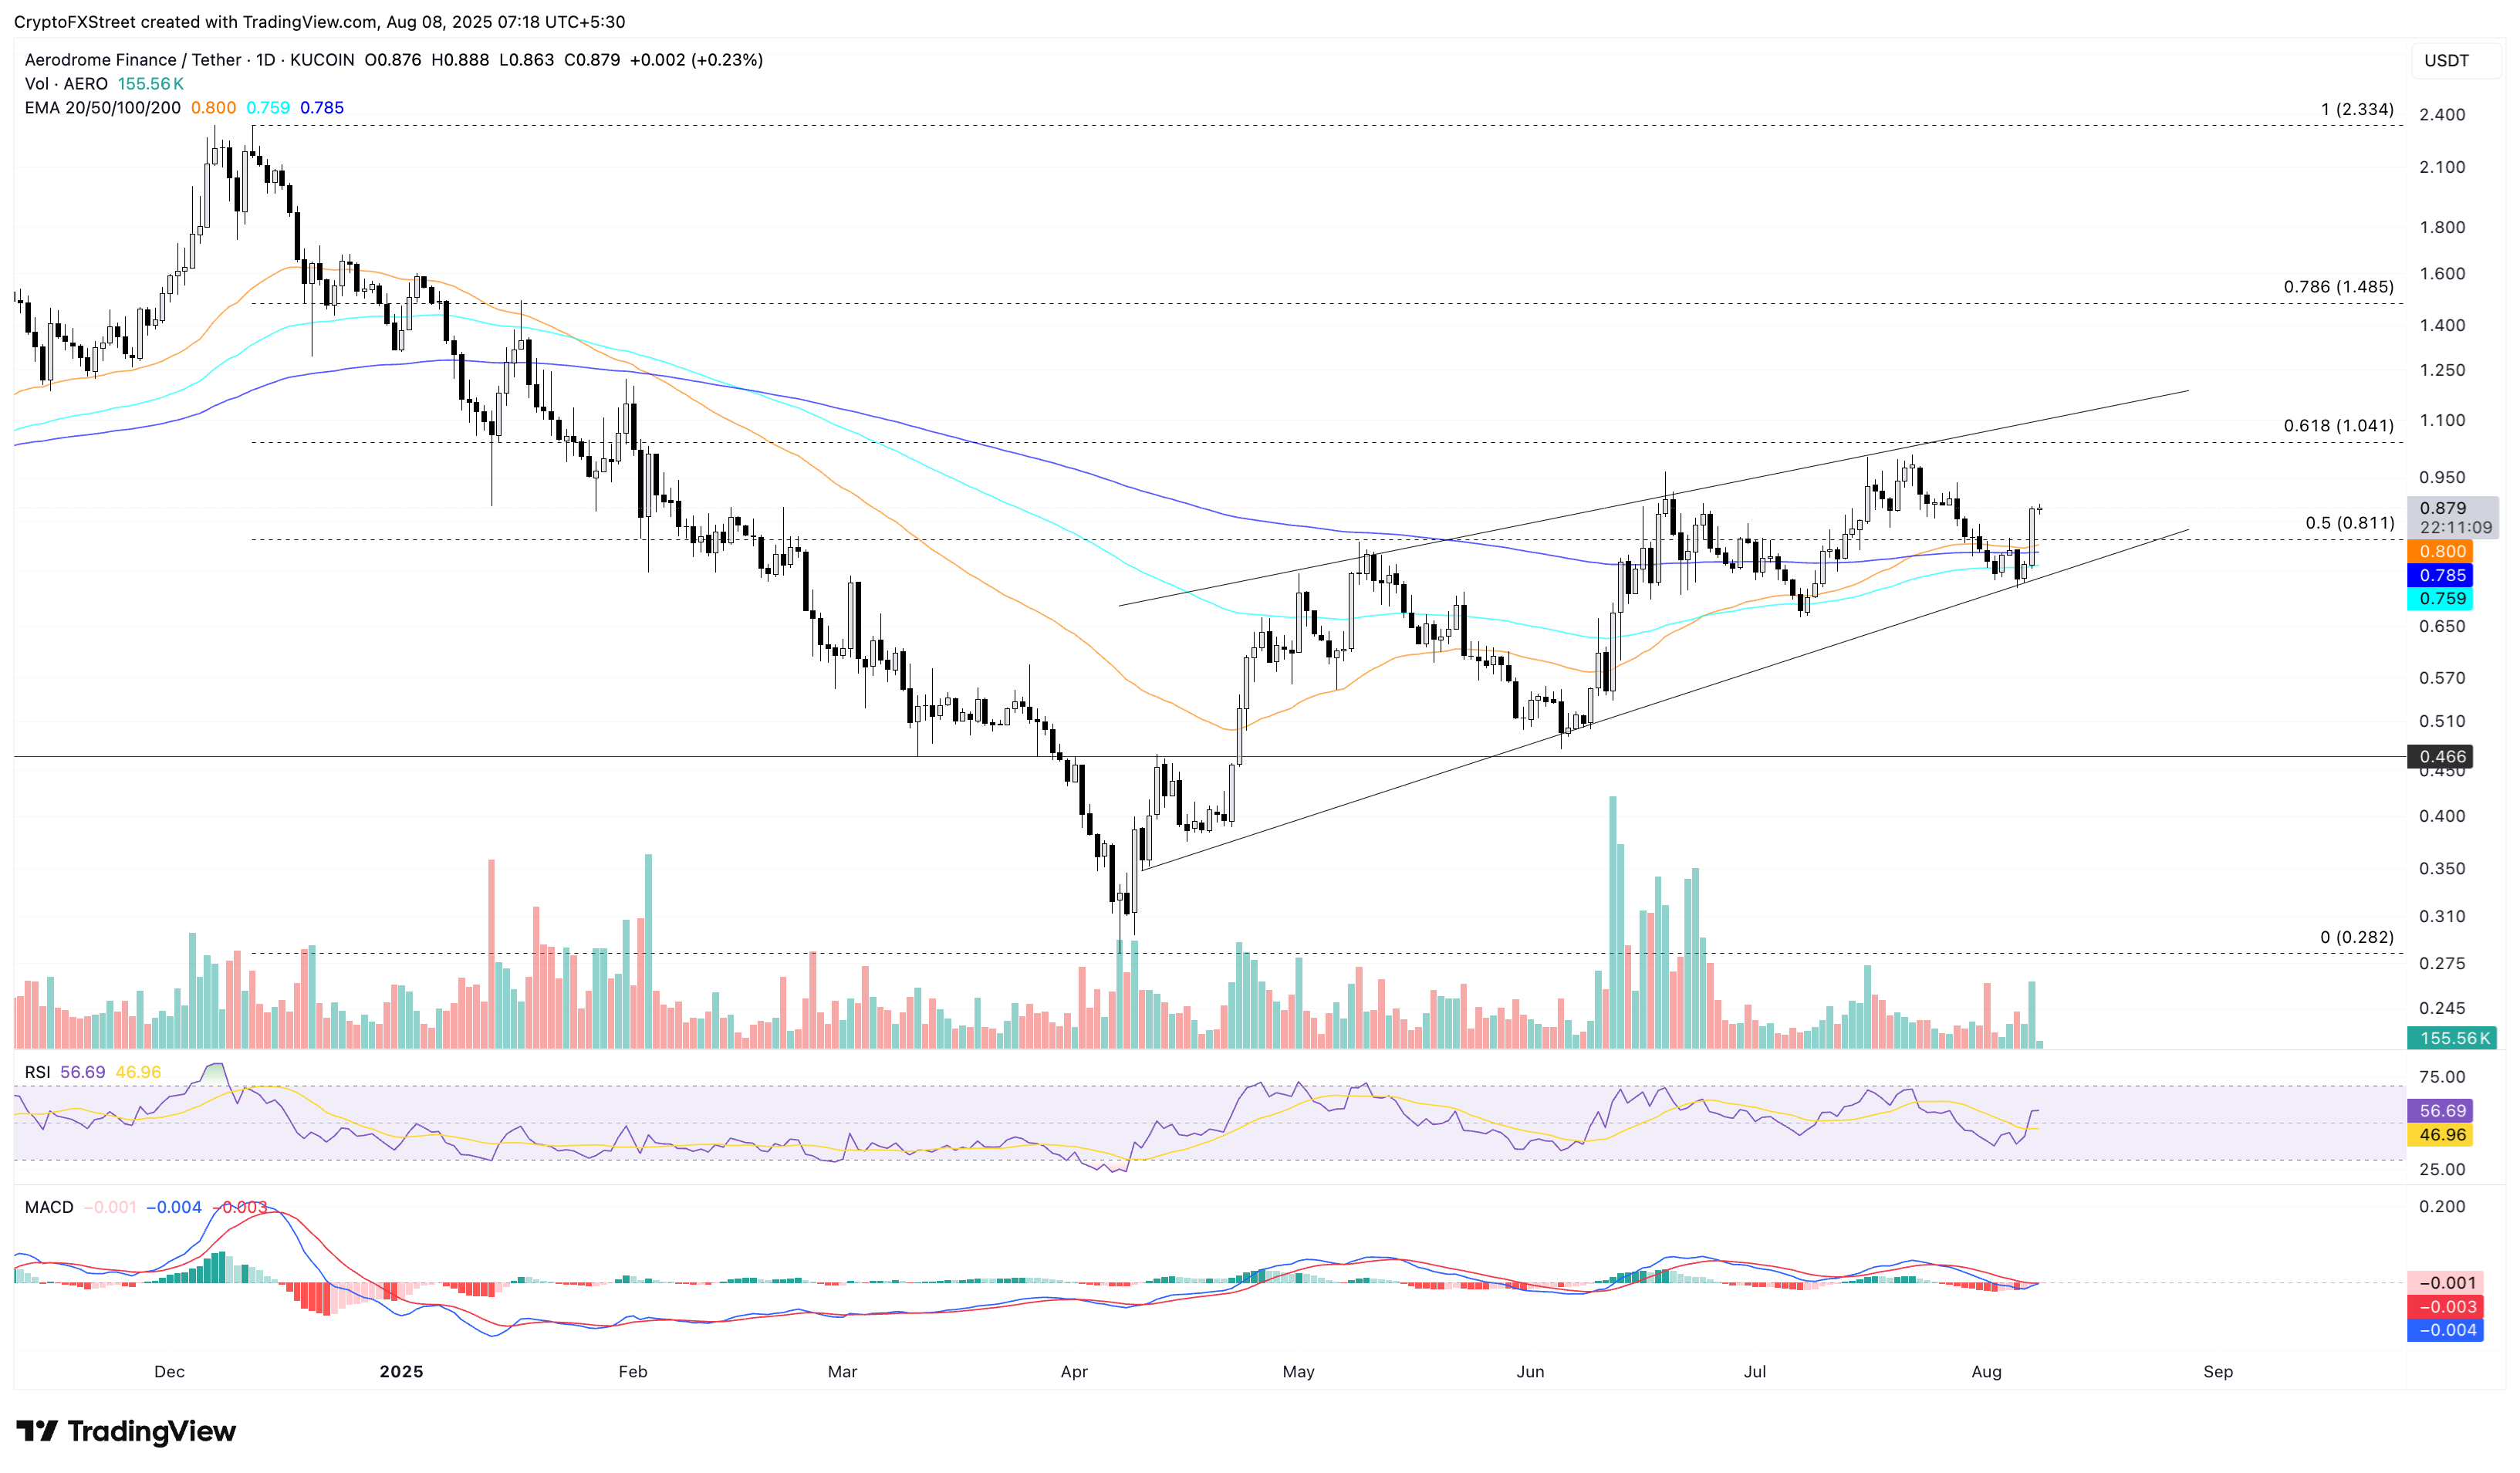
AERO/USDT daily price chart.
Looking down, a reversal below the $0.81 level would retest the 100-day EMA at $0.75.
Author

Vishal Dixit
FXStreet
Vishal Dixit holds a B.Sc. in Chemistry from Wilson College but found his true calling in the world of crypto.


