Crypto Gainers Today: OKB, Mantle, and MemeCore drive gains amid market volatility
- OKB extends the uptrend with bulls targeting a new all-time high.
- Mantle eyes a major trend reversal with its third consecutive bullish week.
- MemeCore’s swift bullish turnaround keeps the price action volatile.

OKB (OKB), Mantle (MNT), and MemeCore (M) lead the gains as the cryptocurrency market remains volatile with Bitcoin (BTC) and other top altcoins under pressure. The recovery run in OKB and Mantle aims to reach a record high, while MemeCore’s sudden trend reversal keeps the movement volatile.
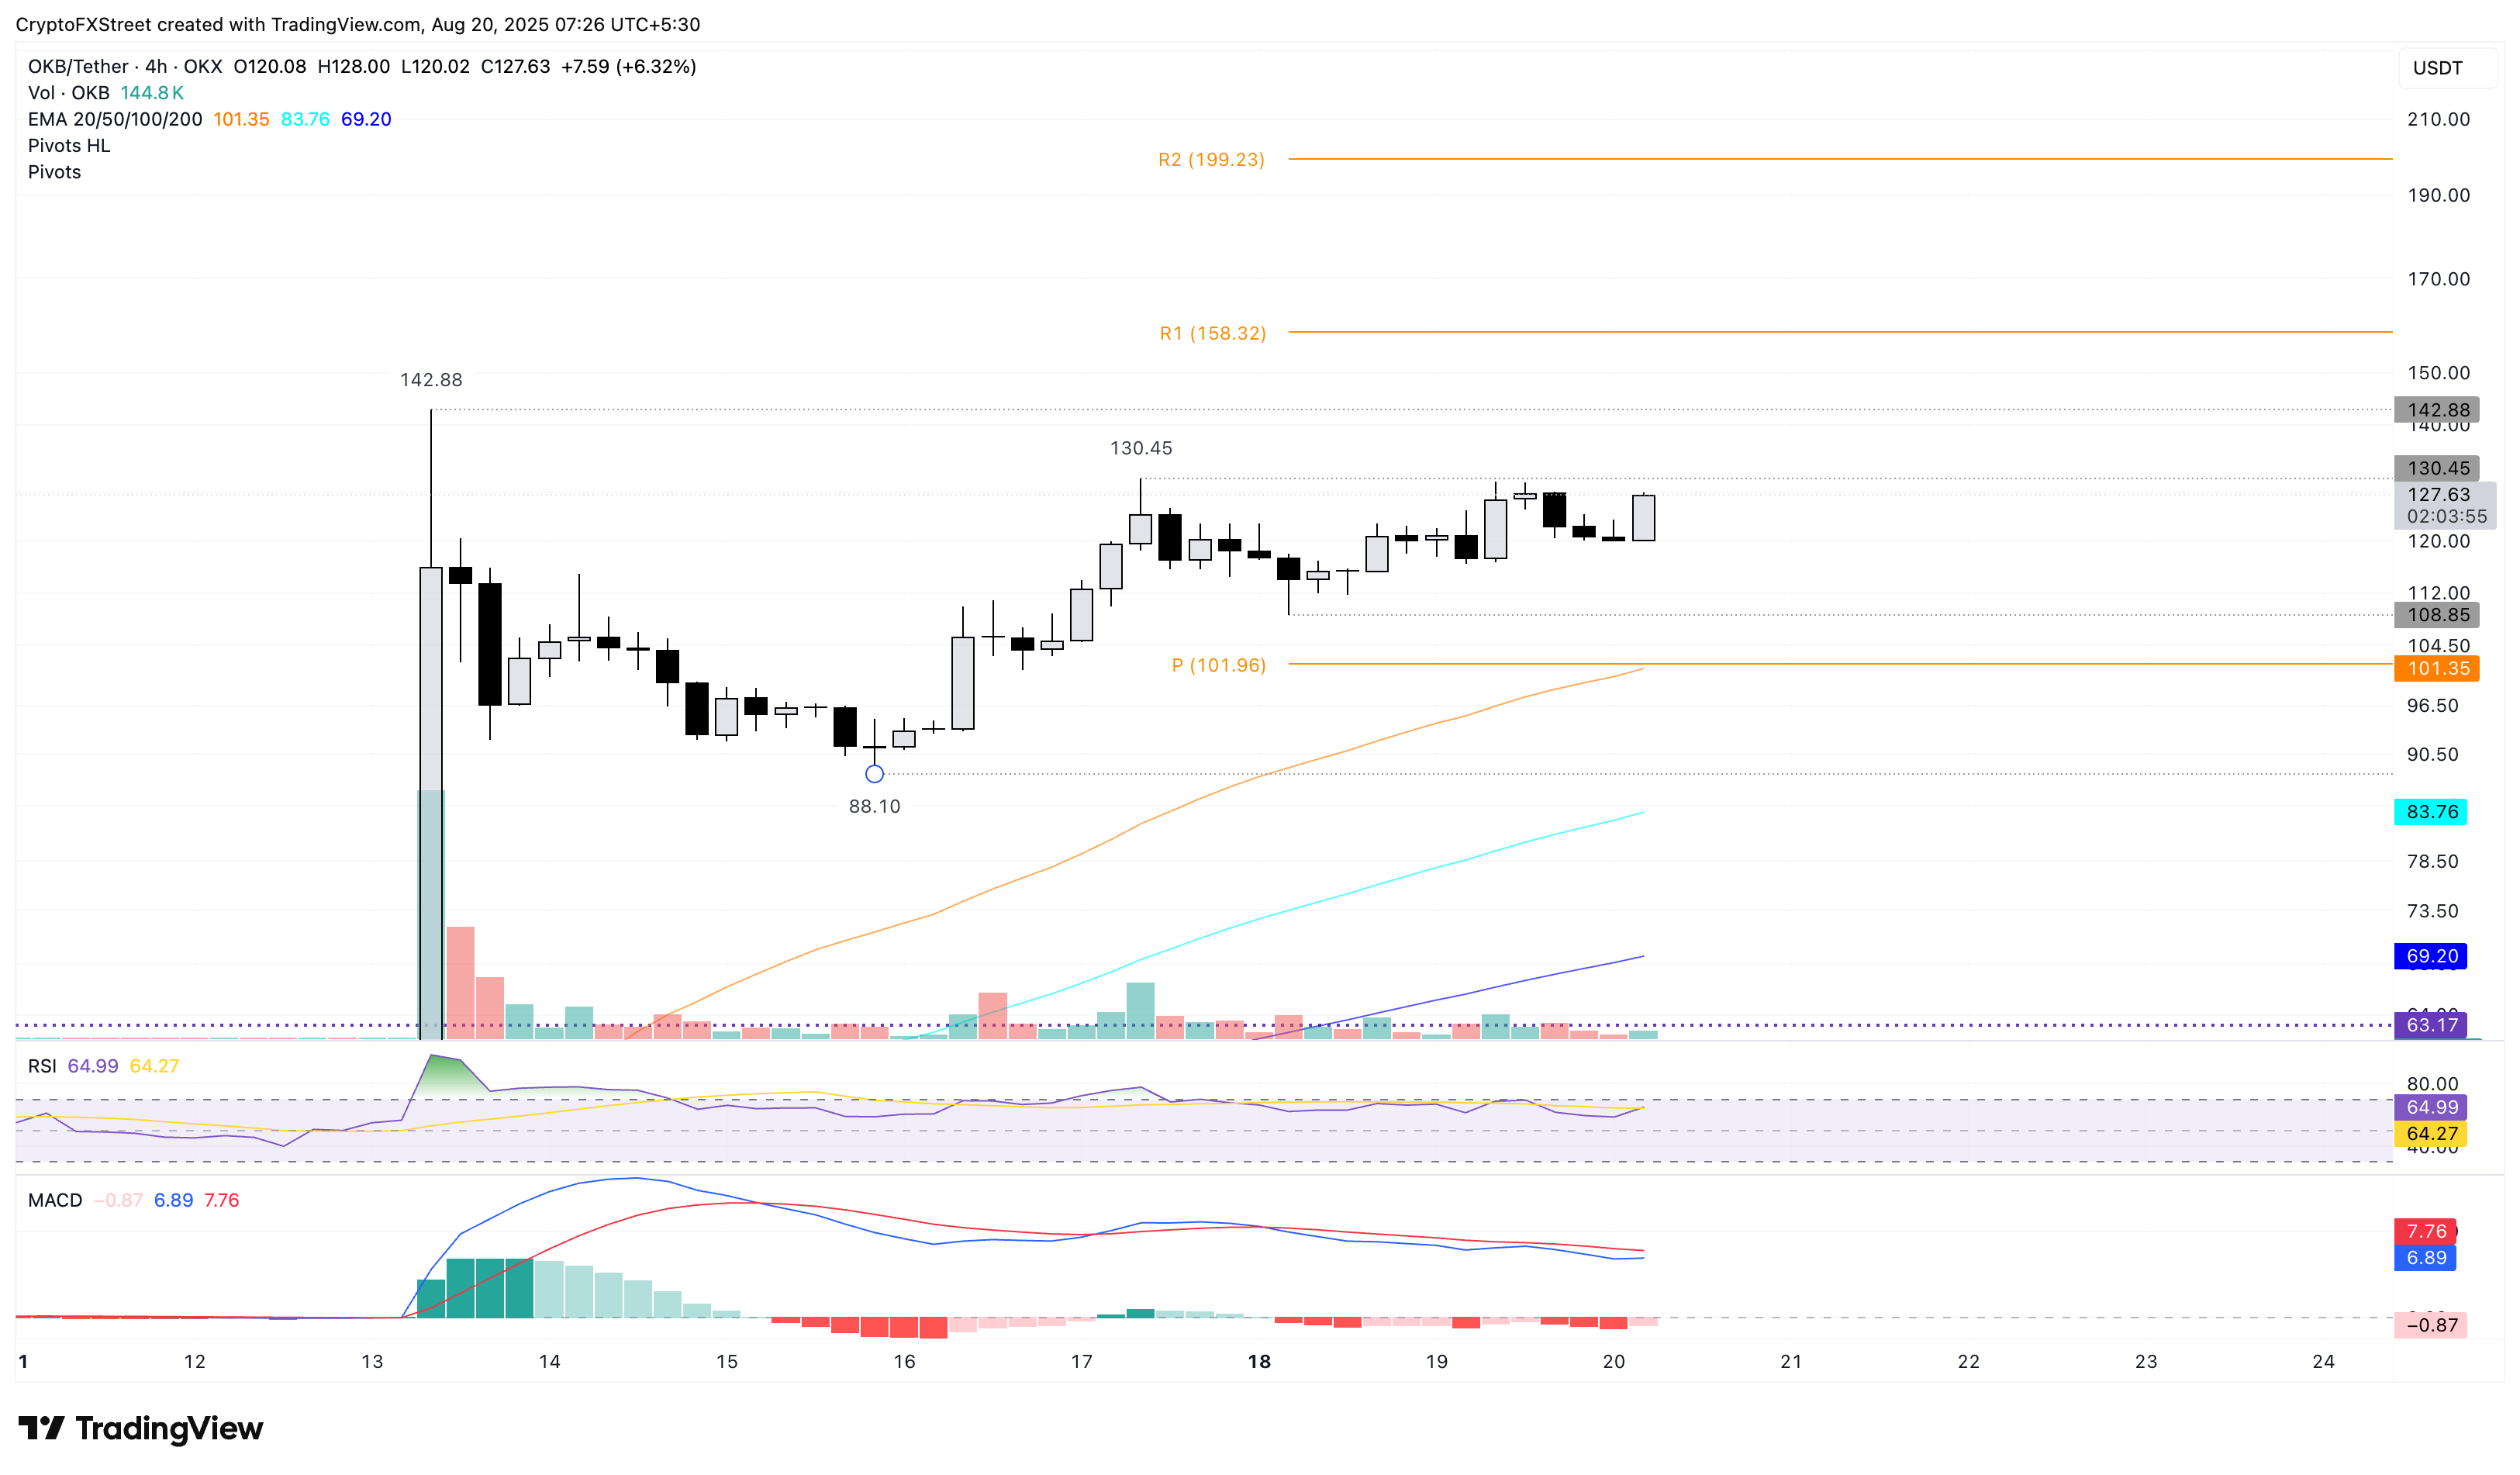
OKB inches closer to untested levels
OKB edges higher by nearly 5% at press time on Wednesday, maintaining an uptrend in the 4-hour chart (shared below). The recovery run targets the $130 pivot point from Sunday.
A decisive close above this level could extend the uptrend to the all-time high of $142, marked last week.
The momentum indicators on the 4-hour chart remain mixed. The Moving Average Convergence Divergence (MACD) and its signal line approach the zero line in a declining trend, indicating a gradual rise in bearish momentum.
Still, the Relative Strength Index (RSI) at 64 hovers near the overbought boundary, indicating elevated buying pressure.
OKB/USDT daily price chart.
Looking down, a reversal from the $130 mark could test the centre pivot line at $101.
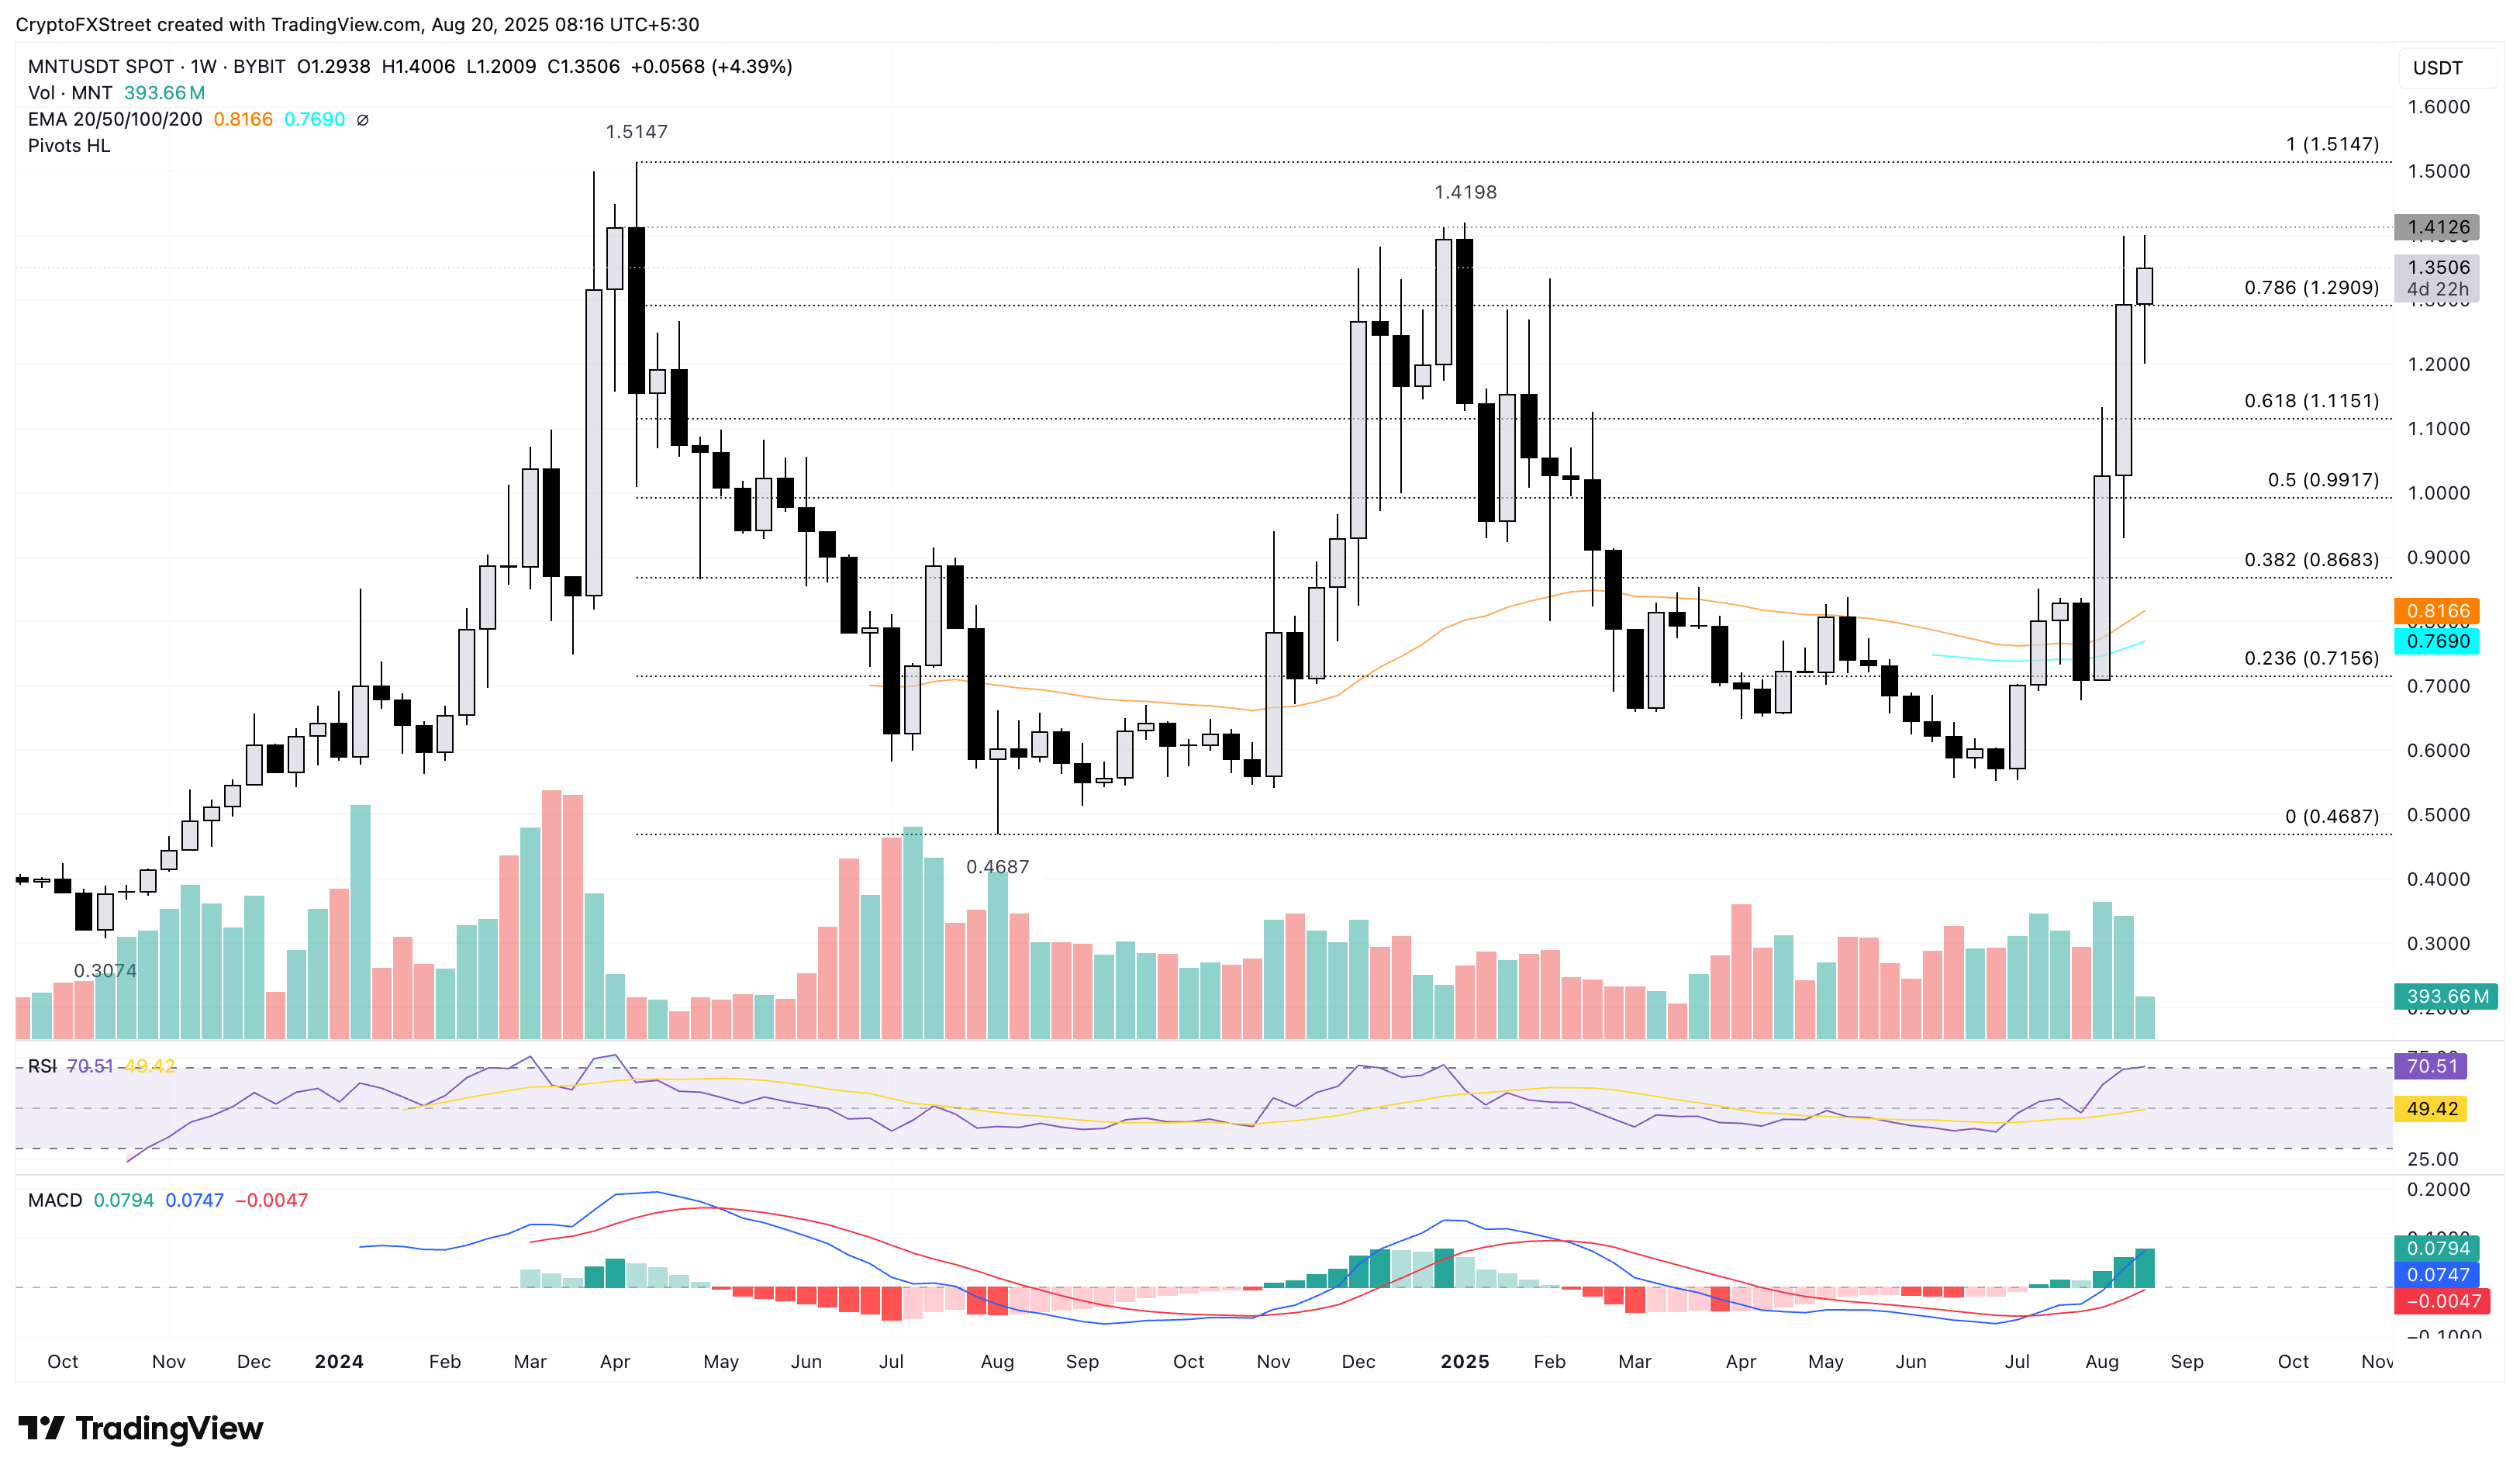
Mantle targets record high
Mantle trades at $1.35 at the time of writing on Wednesday, upholding the 4.30% gains from the previous day. MNT advances into its third consecutive bullish week, accounting for more than 80% gains so far in August.
The uptrend in Mantle targets the $1.41 pivot point, which is also the annual high, from early January. A clean weekly close above this level could drive the rally to its record high of $1.51.
The momentum indicators suggest a bullish bias on the weekly chart as the RSI at 70 hits the overbought boundary and the MACD and signal line rise into the positive territory, accompanied by a fresh wave of green histogram bars.
MNT/USDT weekly price chart.
On the flip side, a reversal could test the 78.6% Fibonacci level at $1.29, which is drawn from the $1.51 peak from April 8, 2024, to the $0.46 on August 5, 2024.
MemeCore’s reversal run eyes further gains
MemeCore bounces off the S2 pivot level at $0.3648 on the 4-hour chart after a sharp decline on Monday. At the time of writing, the meme coin trades at $0.4262, extending the reversal run, with the second consecutive bullish candle on the same chart.
The reversal rally should sustain above the 100-period Exponential Moving Average (EMA) at $0.4248 to extend the uptrend. If MemeCore marks a decisive 4-hour closing above this dynamic average line, it could extend the trend to the R1 pivot level at $0.4845.
The MACD crosses above its signal line while the RSI surpasses its halfway level, indicating a bullish shift in momentum.
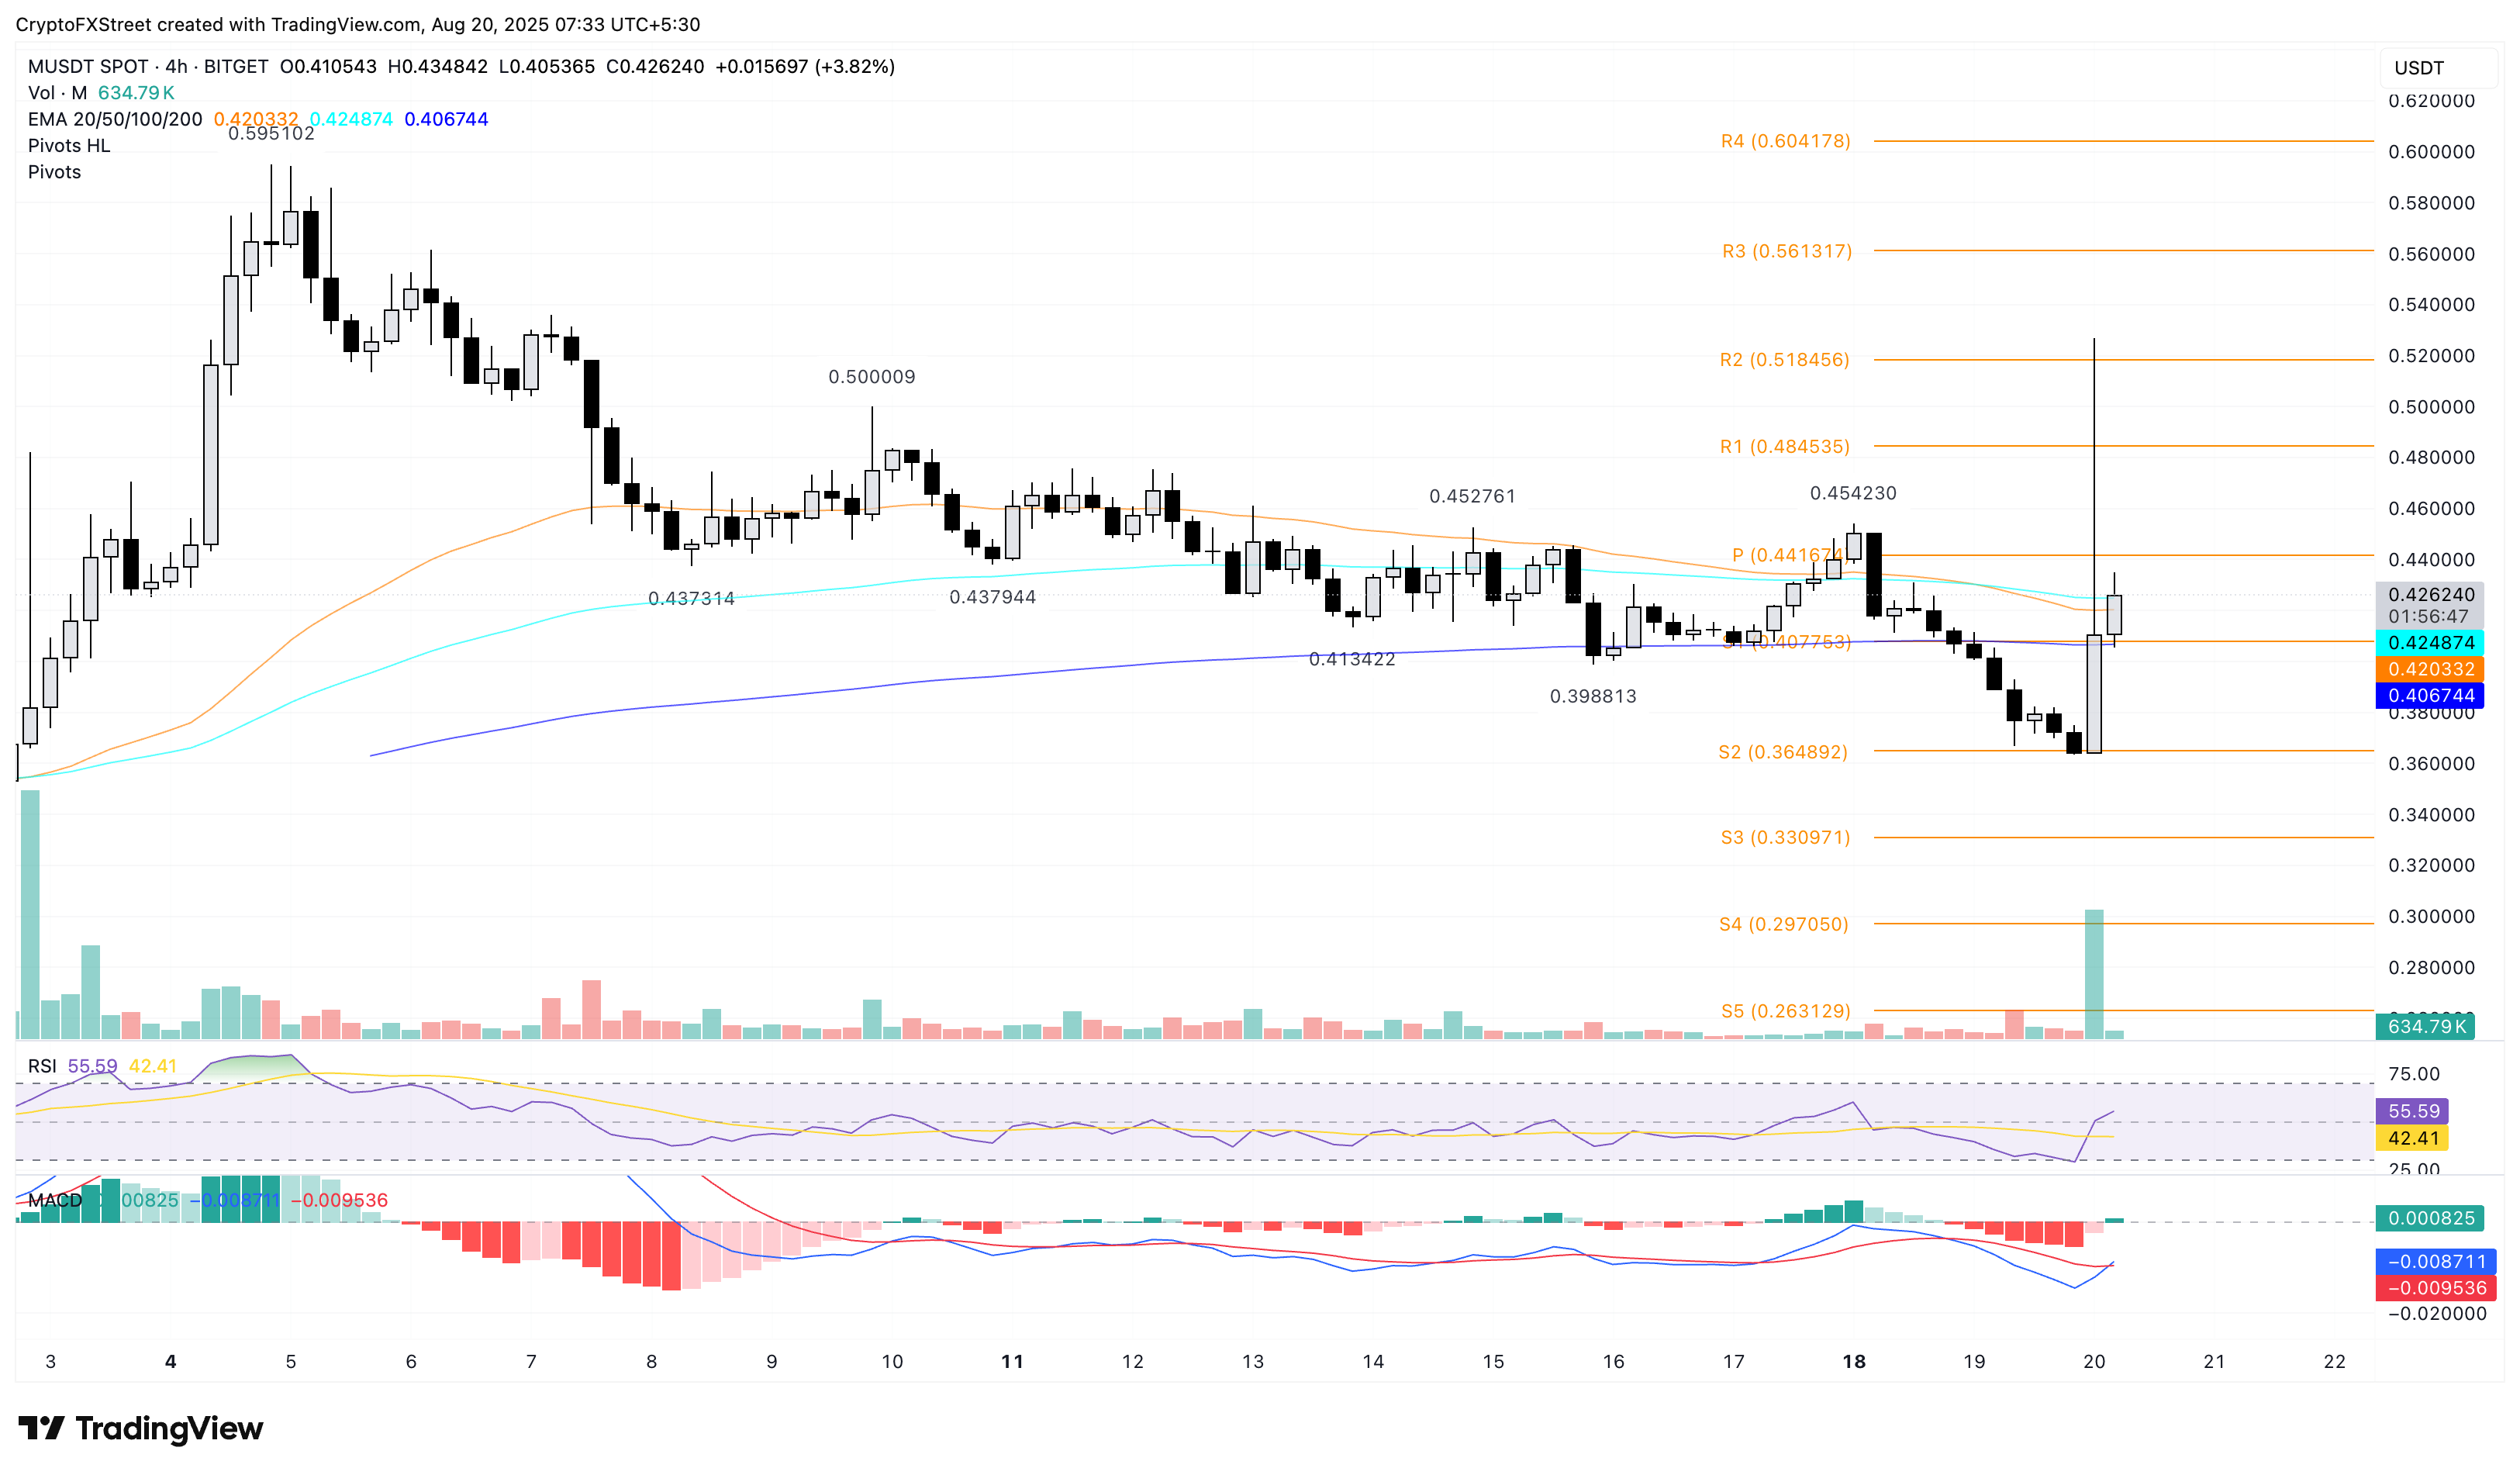
M/USDT weekly price chart.
Looking downside, a pullback below the 200-period EMA at $0.4067 could retest the S2 pivot level at $0.3648.
Author

Vishal Dixit
FXStreet
Vishal Dixit holds a B.Sc. in Chemistry from Wilson College but found his true calling in the world of crypto.


