Crypto Gainers: ONDO, AERO, and PENDLE lead the DeFi tokens recovery
- Ondo Finance extends the uptrend for the sixth consecutive day amid a Bullish Cross.
- Aerodrome Finance bounces off a support trendline, with bulls targeting further growth.
- Pendle edges lower after an 11% surge on Thursday, which reclaimed the $5 milestone.

Decentralized Finance (DeFi) tokens such as Ondo Finance (ONDO), Aerodrome Finance (AERO), and Pendle (PENDLE) are leading the broader cryptocurrency market recovery based on the last 24-hour gains. The double-digit surge in Open Interest of these DeFi tokens suggests increased interest among traders, who possibly anticipate further recovery. The technical outlook remains relatively optimistic as the uptrend holds momentum.
Retail interest sparks in DeFi tokens
CoinGlass data shows that the Open Interest (OI) of ONDO, AERO, and PENDLE has increased by 20%, 16% and 12% in the last 24 hours, reaching $607.98 million, $102.59 million, and $149.34 million, respectively. This increase in capital inflow of DeFi token derivatives suggests that the retail demand has increased as traders anticipate the ongoing recovery run to follow through.
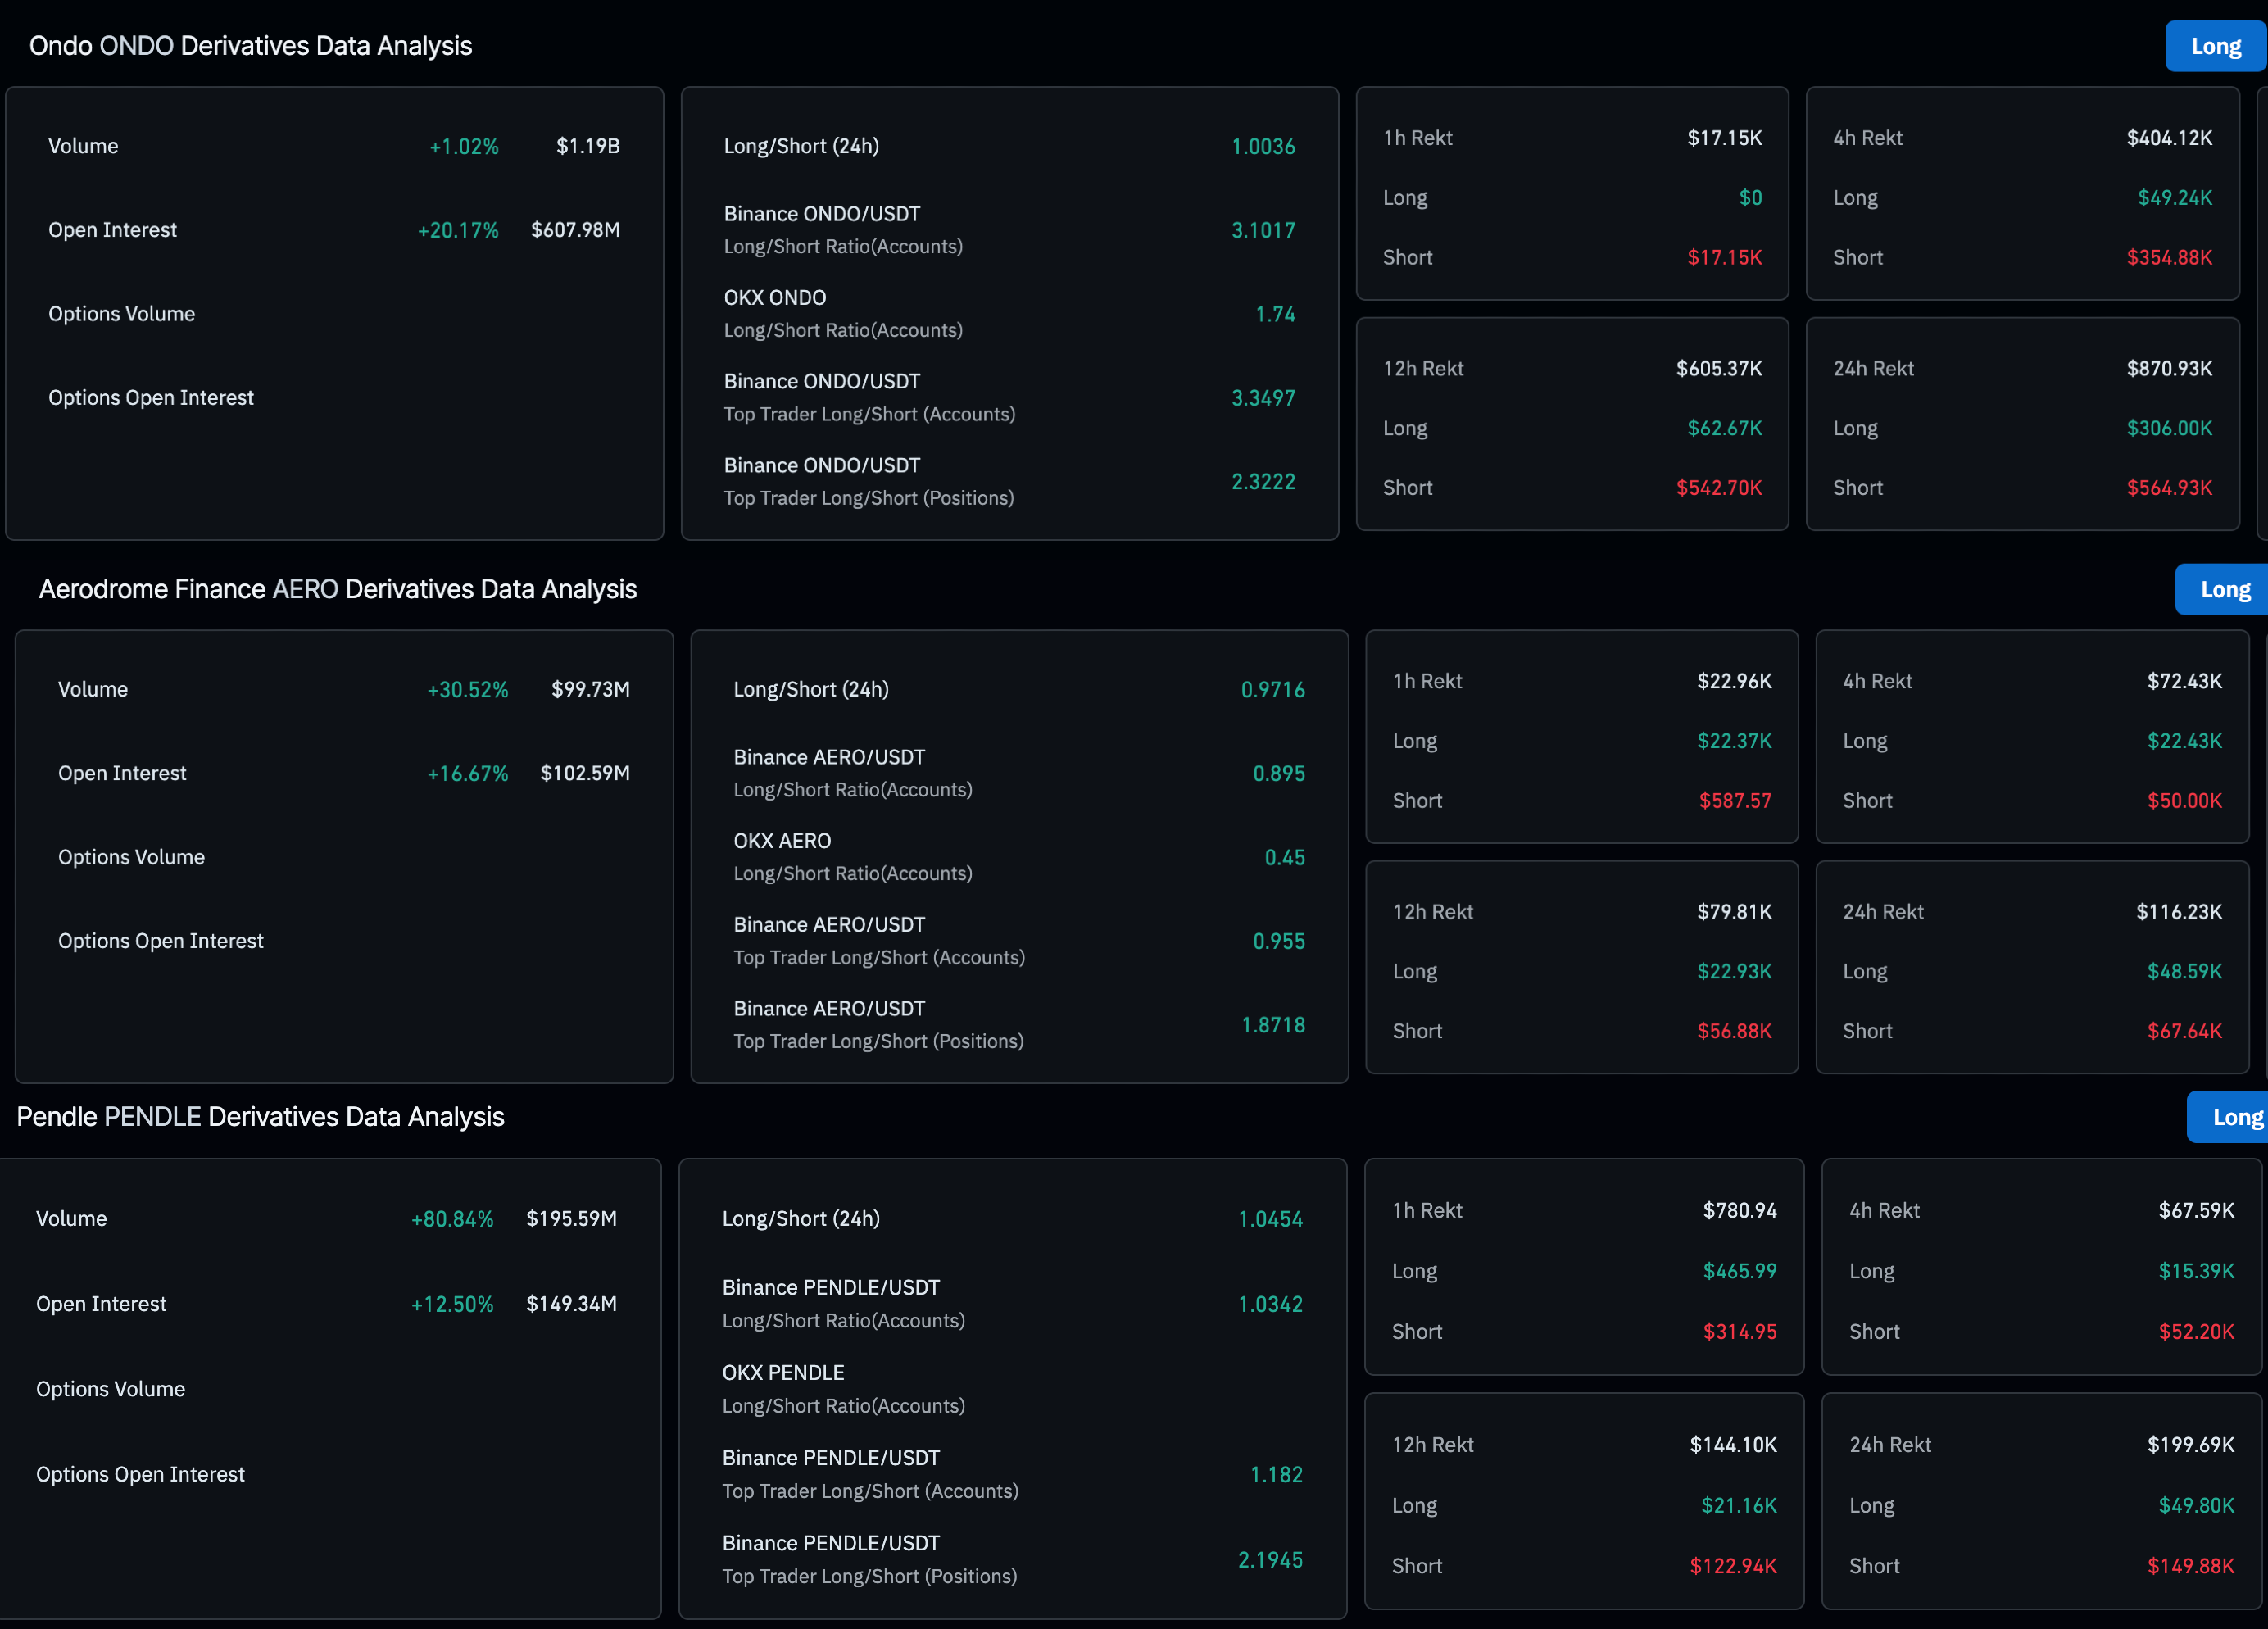
DeFi Tokens Open Interest. Source: CoinGlass
Ondo gains traction amid a Bullish Cross
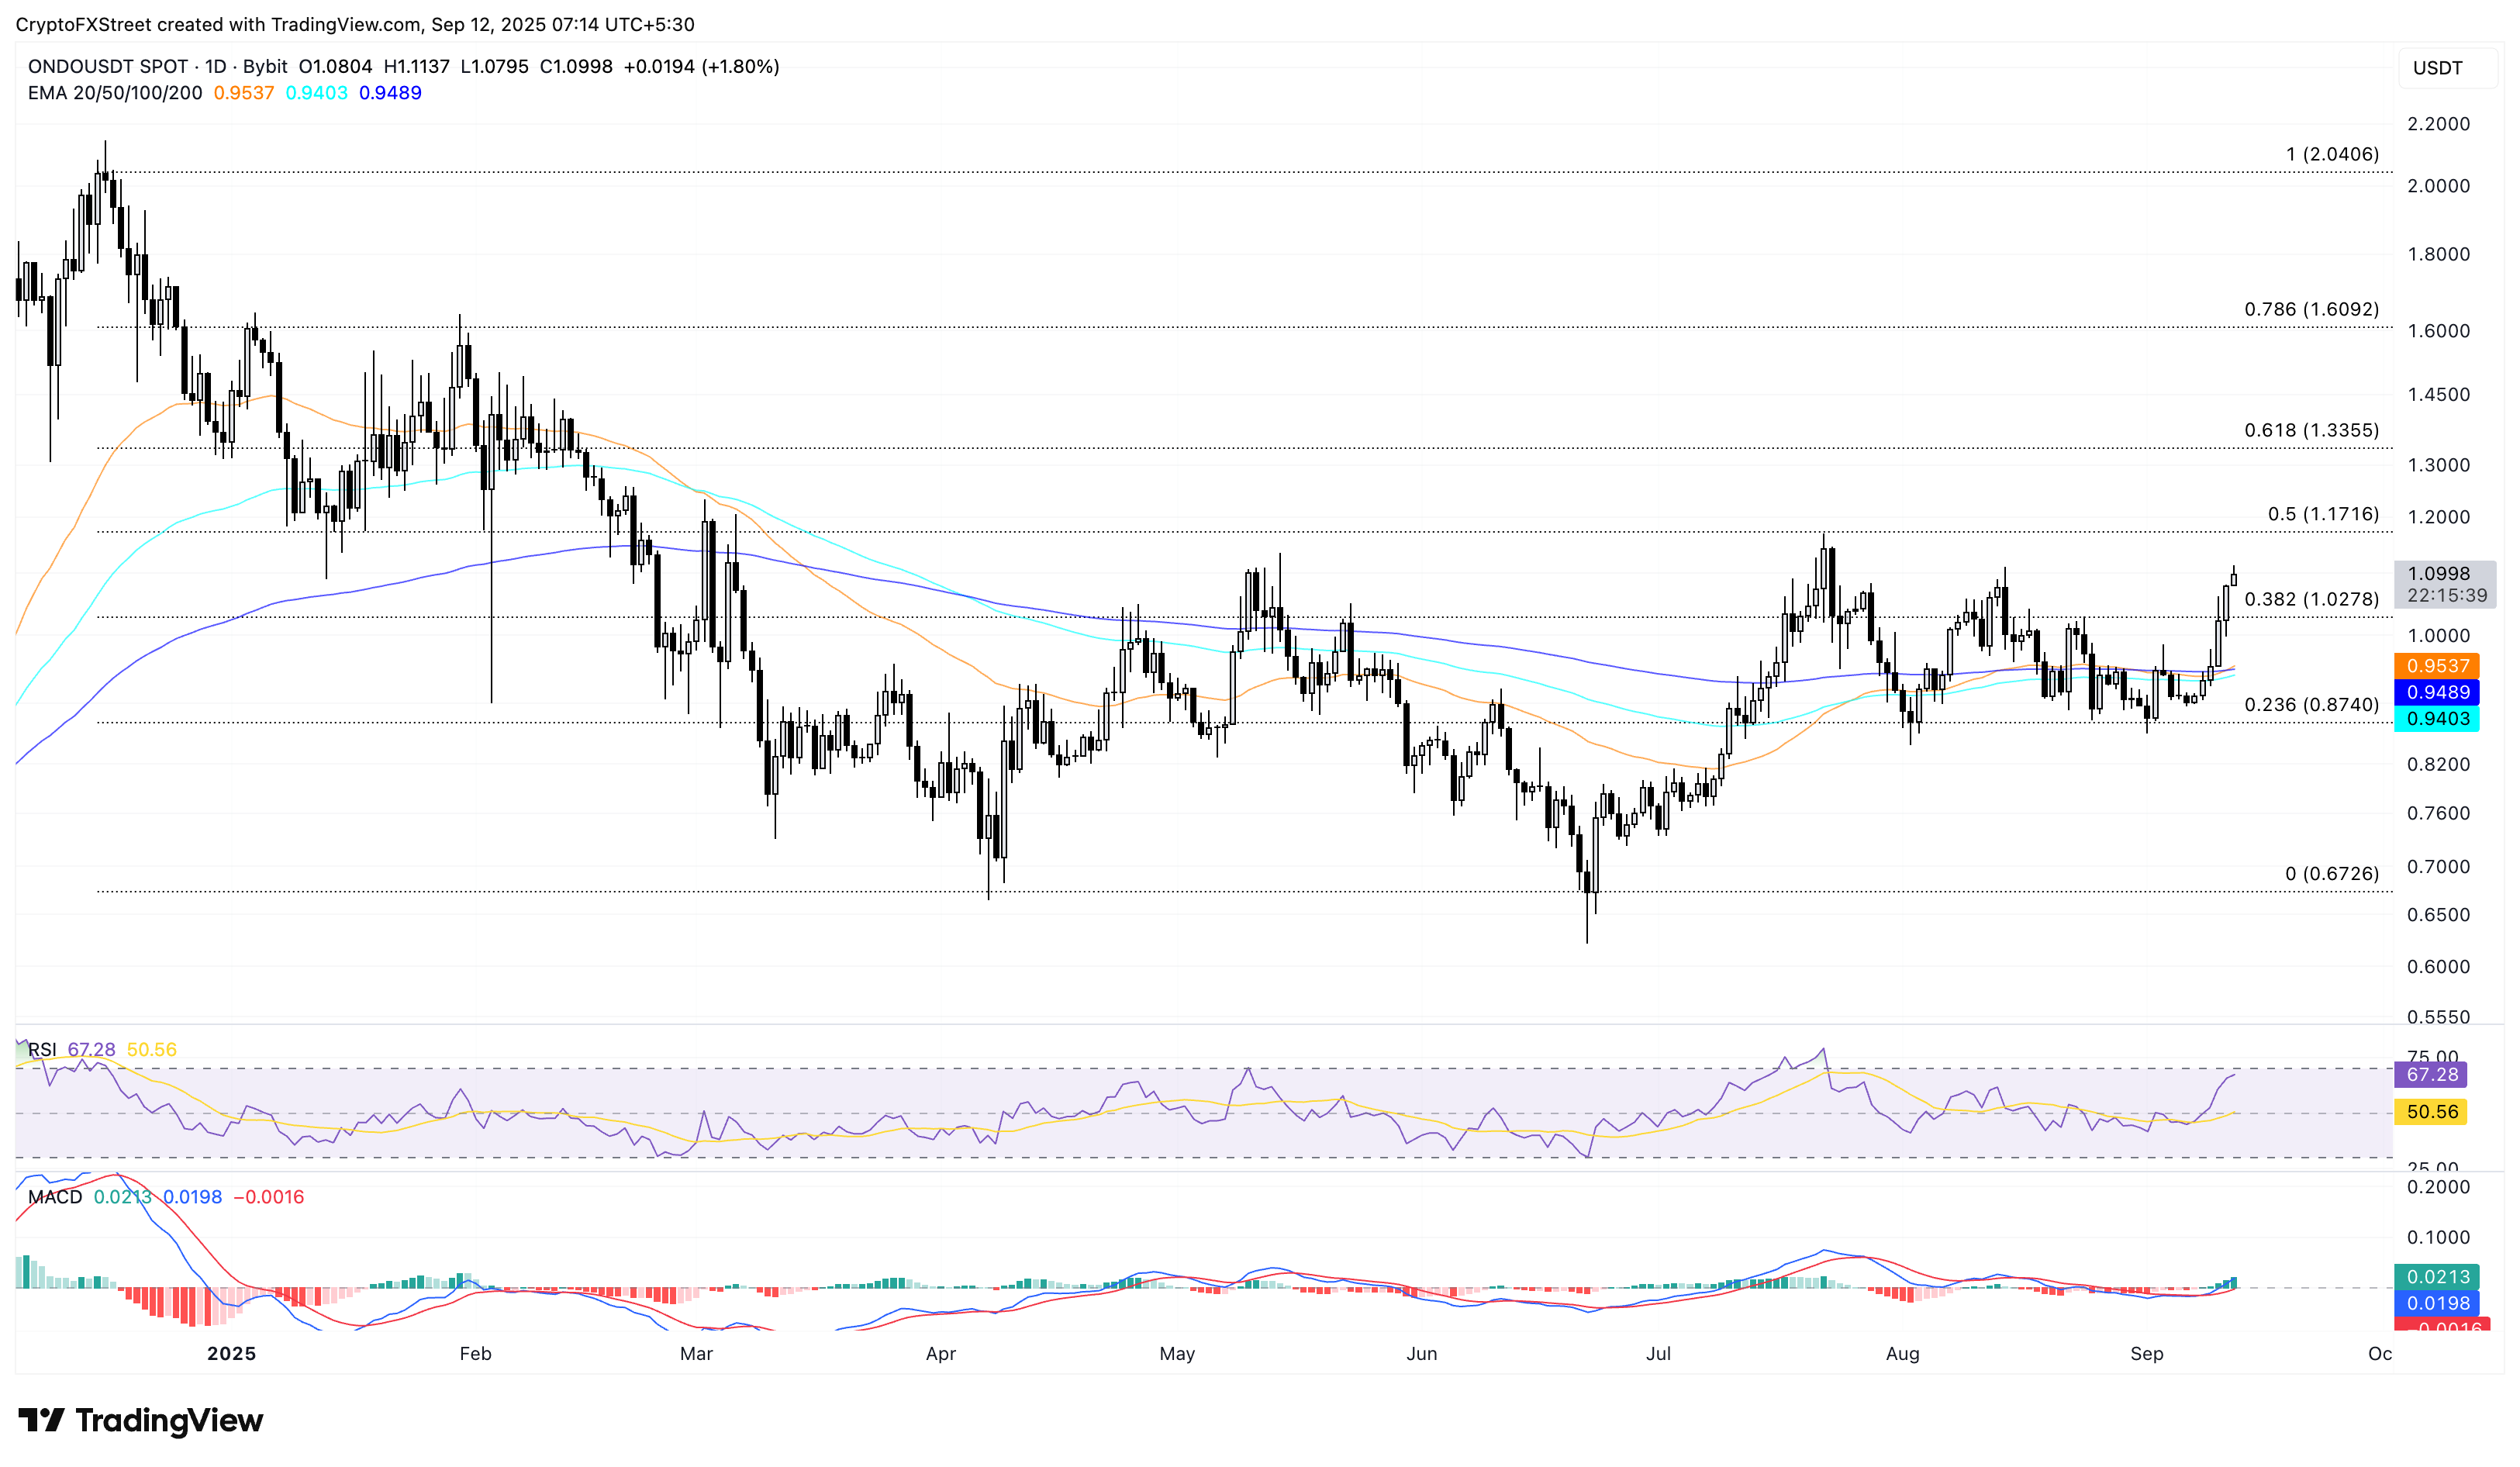
Ondo holds a steady rise above the $1.00 psychological level, extending the gains for the sixth consecutive day. At the time of writing, ONDO appreciates nearly 2% on Friday, targeting the 50% retracement level at $1.17, which is retraced between the December 15 close at $2.04 to the June 22 close at $0.62.
A clean push above this level could extend the rally to the 61.8% Fibonacci retracement level at $1.33.
Adding to the rally, the rising 50-day Exponential Moving Average (EMA) has crossed above the 200-day EMA, suggesting that the short-term recovery has outpaced the prevailing trend. This crossover is generally called a Bullish Cross, and sidelined investors could consider this a buy signal.
The Moving Average Convergence Divergence (MACD) and its signal line surge above the zero line, with a subsequent rise in green histogram bars suggesting an increase in bullish momentum. Furthermore, the Relative Strength Index (RSI) at 67 sustains an upward trend, targeting the overbought zone, which indicates a heightened buying pressure.
ONDO/USDT daily price chart.
Looking down, a potential flip in ONDO’s uptrend could result in the retest of the 38.2% Fibonacci retracement level at $1.02.
Aerodrome Finance eyes recovery amid bullish shift in momentum
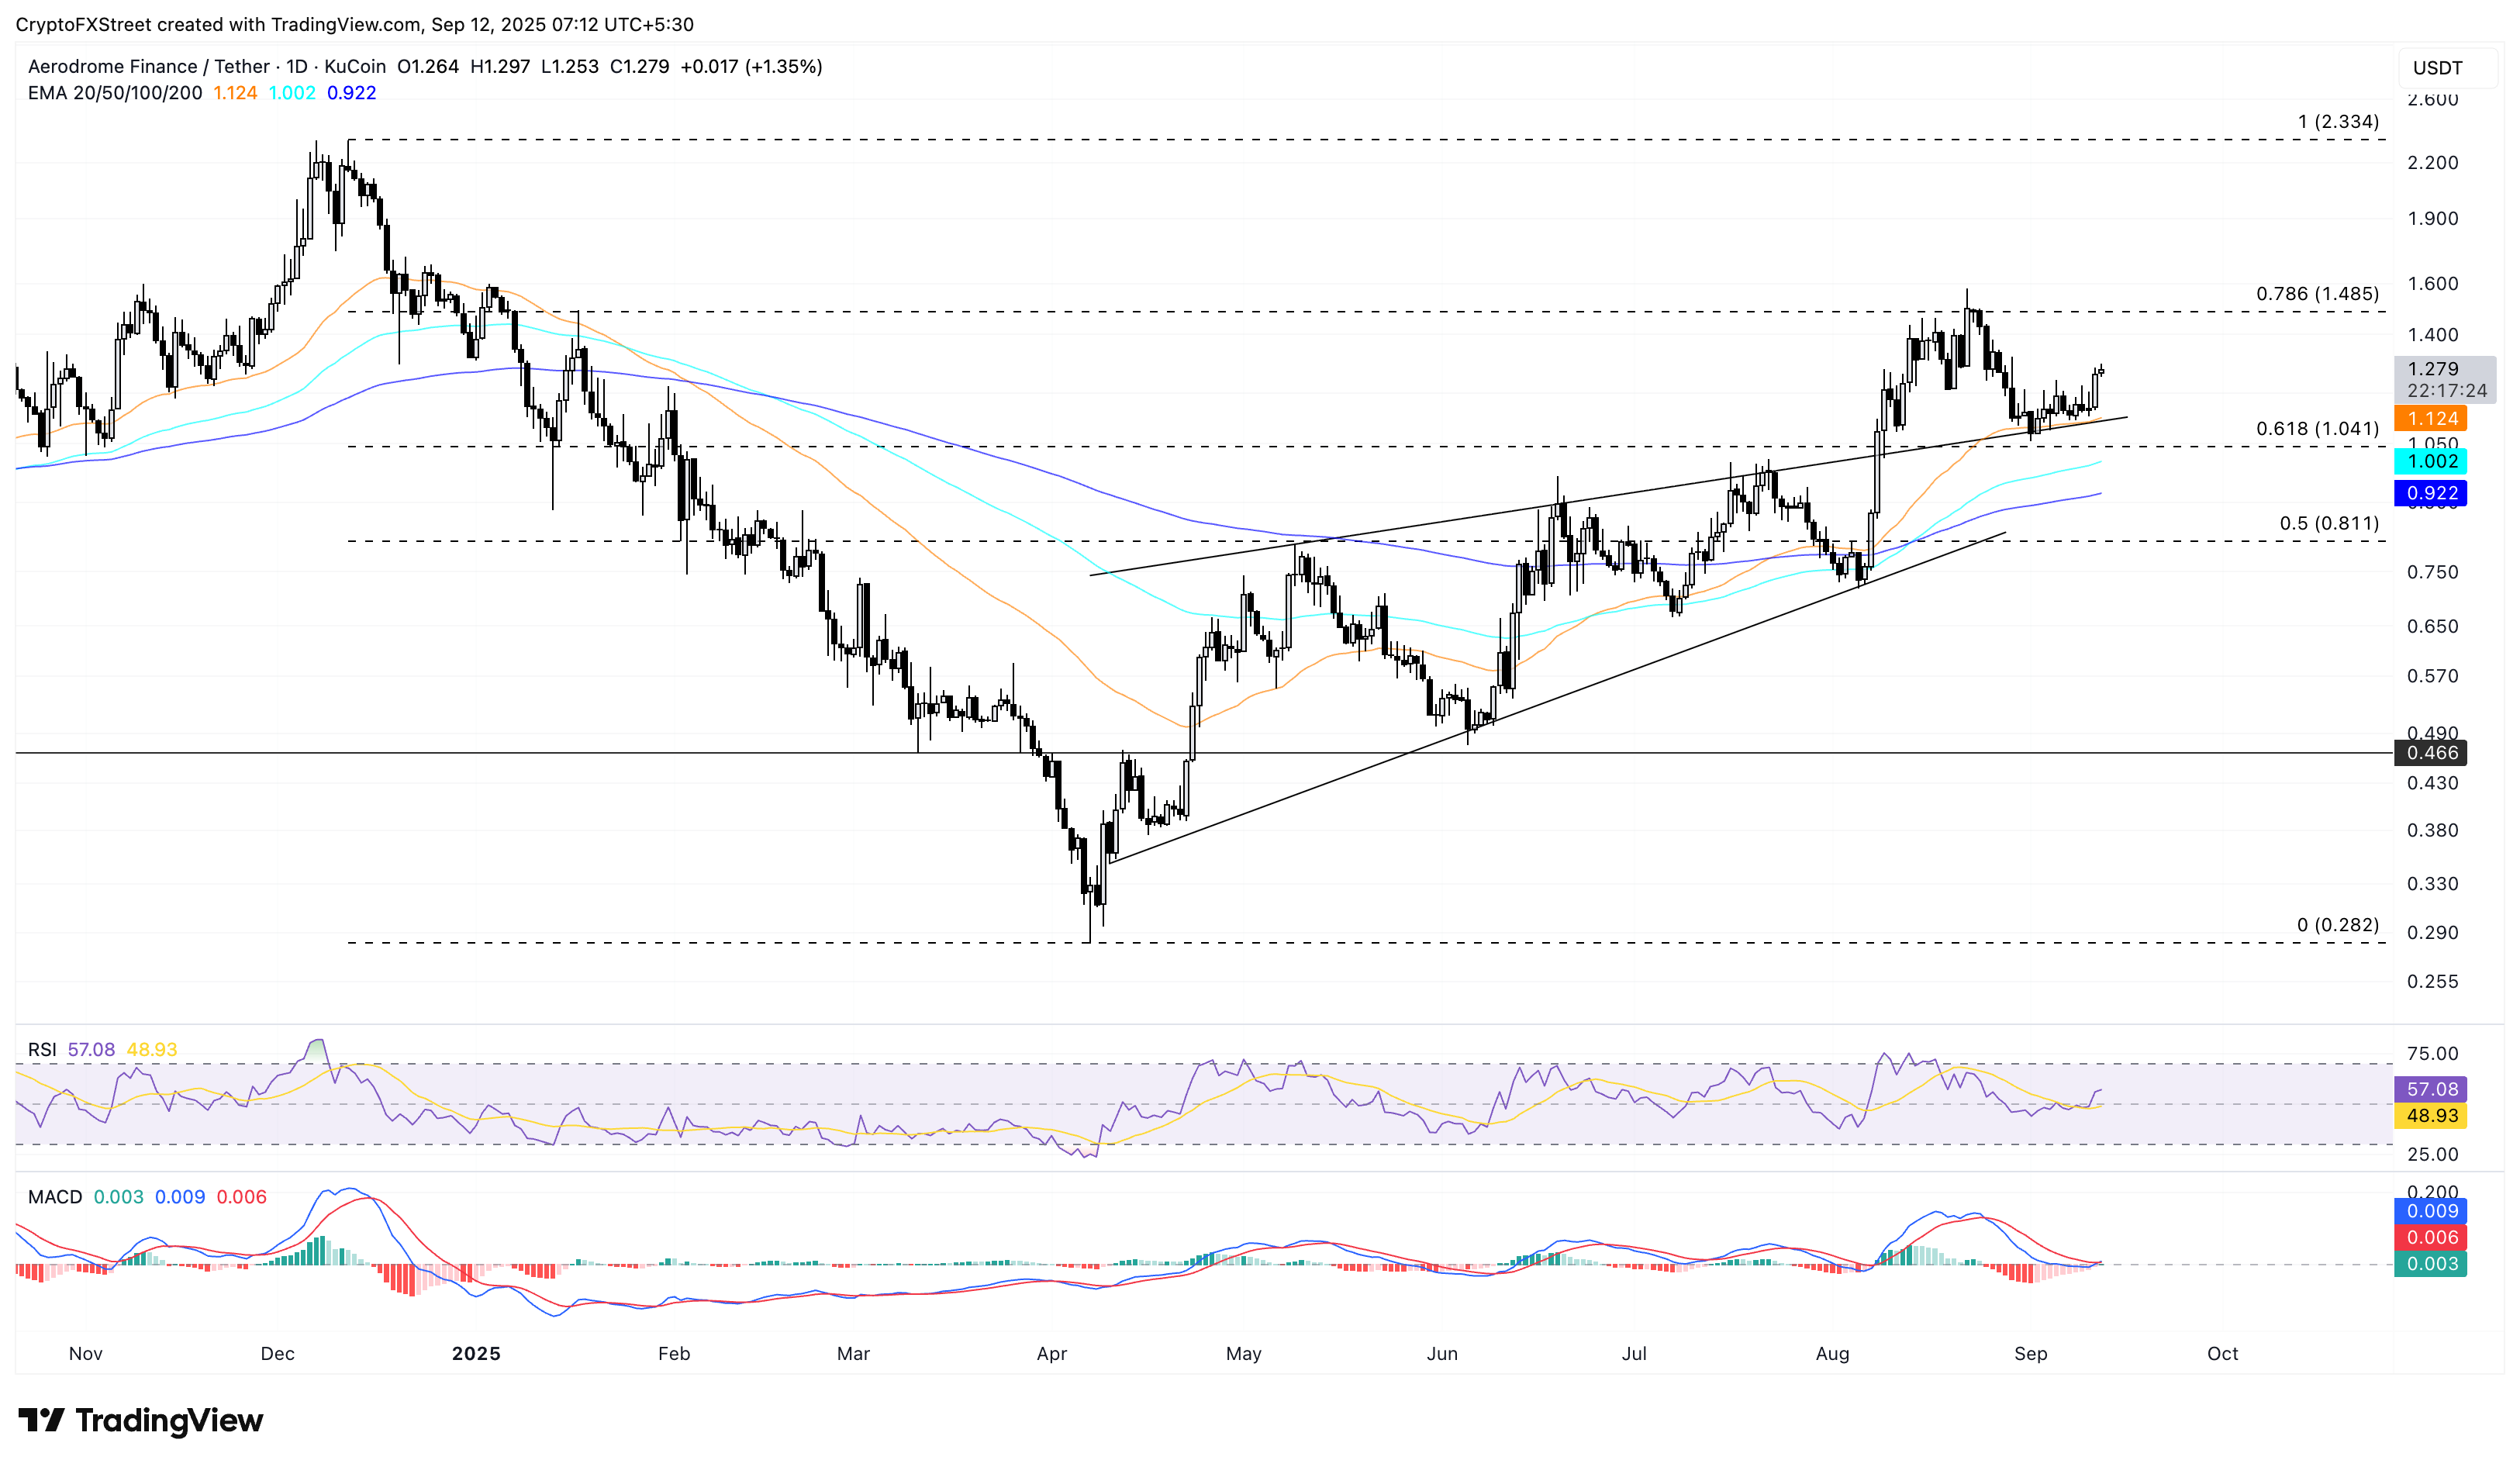
Aerodrome Finance edges higher by 1% at press time on Friday, advancing on the bounce off from the 50-day EMA. The DeFi token targets the 78.6% Fibonacci retracement level at $1.48, which is drawn from the $2.33 high of December 12 to the $0.28 low from April 7, at $1.04.
The momentum indicators on the daily chart signal a positive shift in AERO’s price trend as the RSI crosses above the halfway line, reaching 57, which indicates a rise in buying activity with further room for growth.
Additionally, the MACD converges with its signal line, hinting at a potential crossover as the red histogram bars decline. If MACD crosses above its signal lines, it would indicate a resurgence of bullish momentum.
AERO/USDT daily price chart.
On the flip side, if AERO reverses to the downside, it could extend the decline to the 50-day EMA at $1.12.
Pendle struggles to extend the recovery
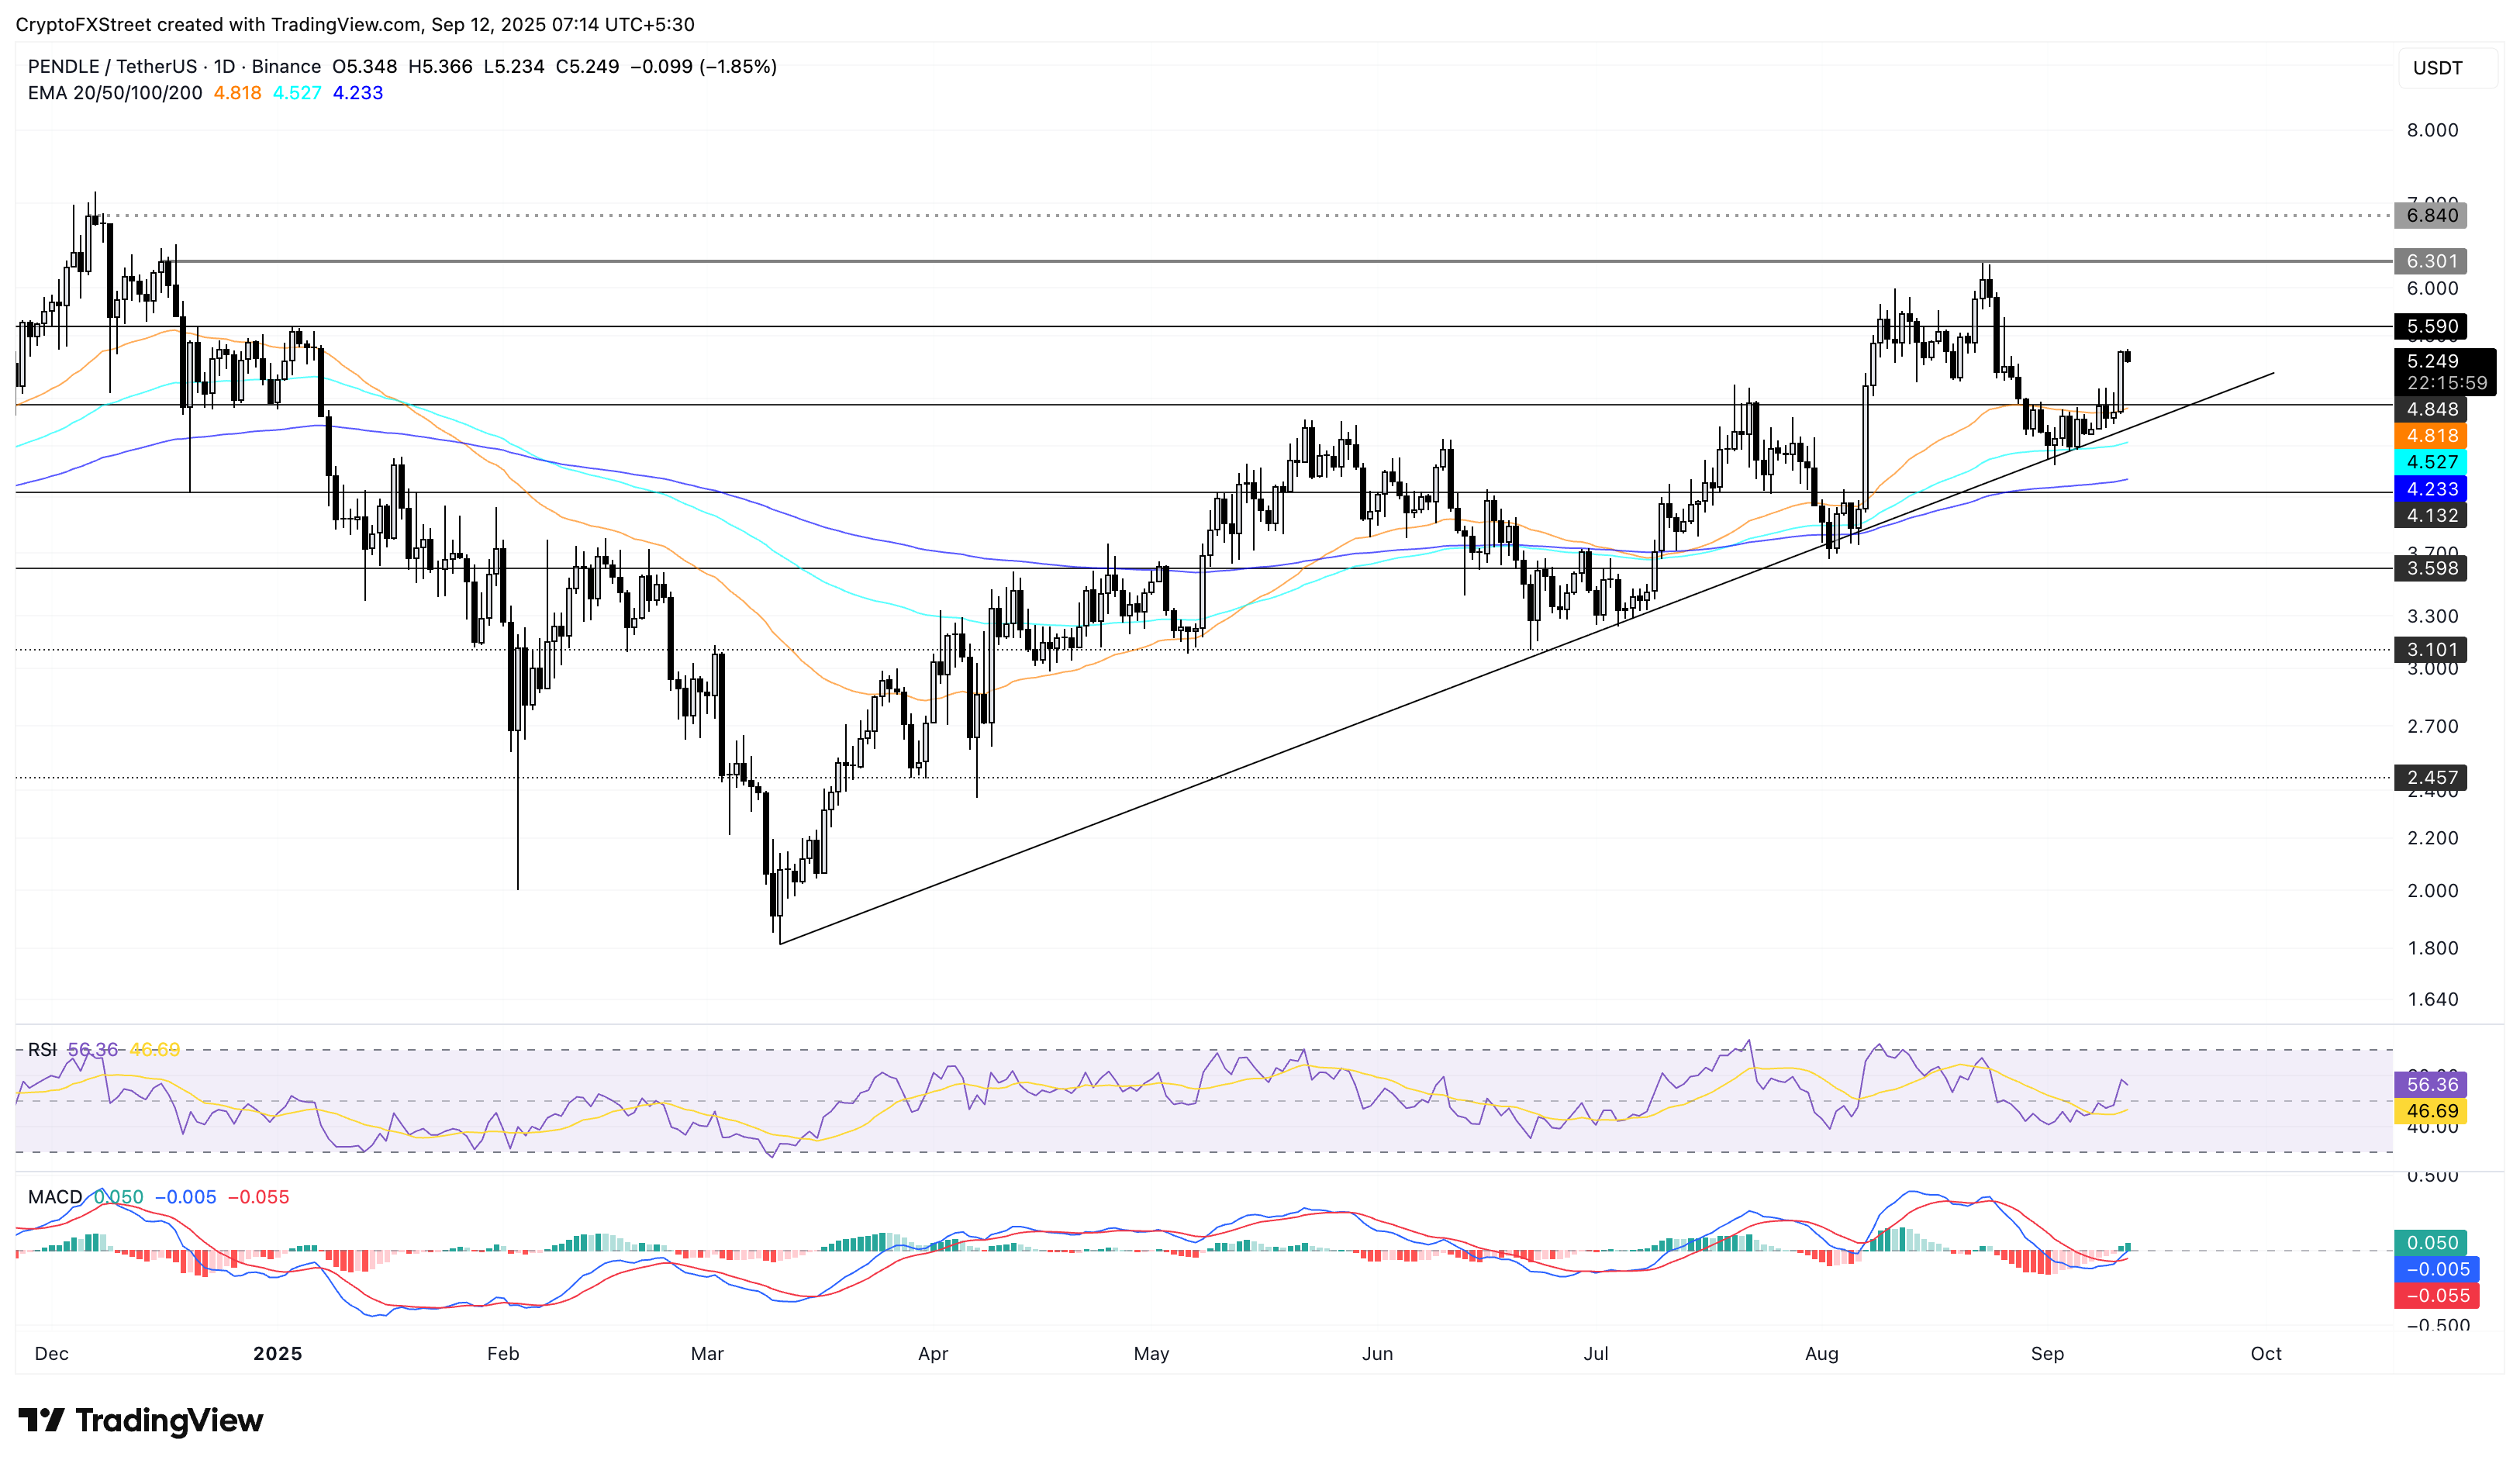
Pendle edges lower by nearly 2% at the time of writing on Friday, following an 11% gain on Thursday, which extended the reversal from a support trendline on the daily chart. The uptrend targets the $5.59 level, last tested on August 26.
A clean push above this level could reach the $6.30 level, marked by the December 16 close.
The MACD crossing above its signal line triggers a buy signal as bullish momentum resurfaces. The RSI at 56 hovers above the halfway line, indicating a rise in buying pressure.
PENDLE/USDT daily price chart.
On the downside, if PENDLE extends the intraday pullback, it could test the 50-day EMA at $4.81.
Author

Vishal Dixit
FXStreet
Vishal Dixit holds a B.Sc. in Chemistry from Wilson College but found his true calling in the world of crypto.



