Chainlink Technical Analysis: LINK/USD begins bullish recovery after three straight bearish days
- LINK/USD is going through bullish recovery this Wednesday.
- The RSI is trending around 68.18, next to the overbought zone.
- MACD still shows decreasing bullish market momentum.

LINK/USD daily chart
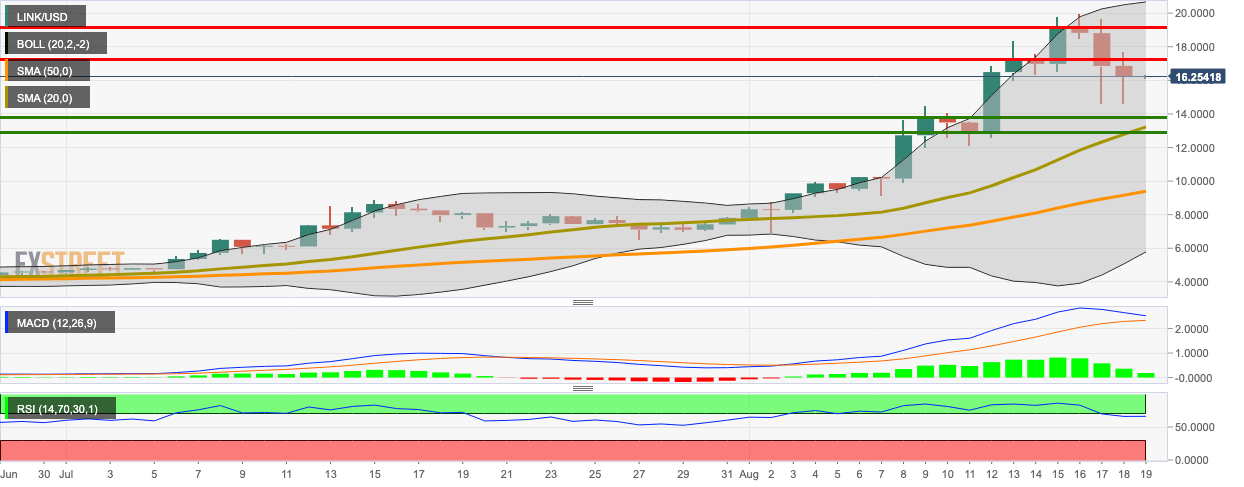
LINK/USD encountered heavy resistance at the $19.10 resistance line and had three consecutive bearish days. It looks like the buyers have decided to step up this Wednesday to initiate a price recovery. So far, LINK/USD has gone up slightly from $16.23 to $16.53. The moving average convergence/divergence (MACD) shows decreasing bullish momentum, while the relative strength index (RSI) is trending next to the overbought zone.
LINK/USD has intense resistance levels at $19.10 and $17.25. On the downside, we have three healthy support levels at $13.90, $13.30 and $12.95.
Author

Rajarshi Mitra
Independent Analyst
Rajarshi entered the blockchain space in 2016. He is a blockchain researcher who has worked for Blockgeeks and has done research work for several ICOs. He gets regularly invited to give talks on the blockchain technology and cryptocurrencies.


