Chainlink surges to two-year high after dormant coins change hands
- LINK trades at $17.84, its highest level since January 2022.
- The recent surge is due to the sudden movement of previously dormant tokens.
- Key momentum indicators confirmed the steady growth in the demand for the altcoin.
Chainlink (LINK) price has risen by more than 17% on Friday, reaching its highest level since January 2021, partly fuelled by sudden movements of long-held coins. Momentum indicators suggest that Chainlink’s upward trend is strong and may continue if positive sentiment is maintained.
Also read: Chainlink price risks another healthy correction despite LINK being an outlier in choppy altcoin market.
LINK touches two-year high
According to on-chain data provider Santiment, LINK’s Age Consumed metric climbed to a high of 5.35 billion on Tuesday, a 404% intraday increase from the previous day’s 1.06 billion.
#Chainlink has jumped ahead of the #altcoin pack after some previously dormant wallets created the highest Age Consumed spike (5.38B, calculated by multiplying coins moved by the amount of days those coins had been dormant). This influx of $LINK back into the
— Santiment (@santimentfeed) February 1, 2024
(Cont) pic.twitter.com/eHVpeJz2HW
An asset Age Consumed metric tracks the number of tokens changing hands on a certain date, multiplied by the time since they last moved. When this metric experiences a spike, it means that a large amount of tokens are changing hands after being left idle for a long period of time.
Long-term holders do not tend to randomly transfer their tokens to new addresses. Therefore, when dormant tokens see renewed activity, it is something to take note of as it suggests a significant shift in market conditions. It may also mark a local bottom or top depending on where the asset’s price goes after such movements.
In LINK’s case, the surge in Age Consumed was followed by an uptick in value, suggesting that the token’s price bottomed at $15.45 on Tuesday. Exchanging hands at $18.07 at the time of writing, LINK’s value has since risen by 17%, according to data from CoinMarketCap.
 [07.14.39, 02 Feb, 2024]-638424513096675529.png)
LINK Age Cosumed. Source: Santiment.
Further, following the rally, LINK saw a decline in the number of wallets holding the token. In its post on X (formerly Twitter), Santiment noted that this liquidation of wallets signaled the presence of fear, uncertainty, and doubt (FUD), which commonly contributes to a price hike.
Bulls hold steady
LINK’s price movements observed on a daily chart confirmed the rally for the altcoin. At the time of writing, its Chaikin Money Flow (CMF), trending upward, returned a value of 0.07. A rising and positive CMF is a sign of strength in the market, as it suggests an inflow of liquidity that can drive a further price rally.
Confirming the strength of the current uptrend, LINK’s Aroon Up Line (orange) was at 100% at the time of writing. An asset’s Aroon Indicator measures the strength of its trend and identifies reversal points. When an asset’s Aroon Up line is close to 100%, it indicates that the uptrend is strong and that the most recent high was reached relatively recently.
Likewise, LINK’s Relative Strength Index (RSI) and Money Flow Index (MFI) rested above their respective midlines, suggesting that traders preferred to buy the token rather than sell it for profit.
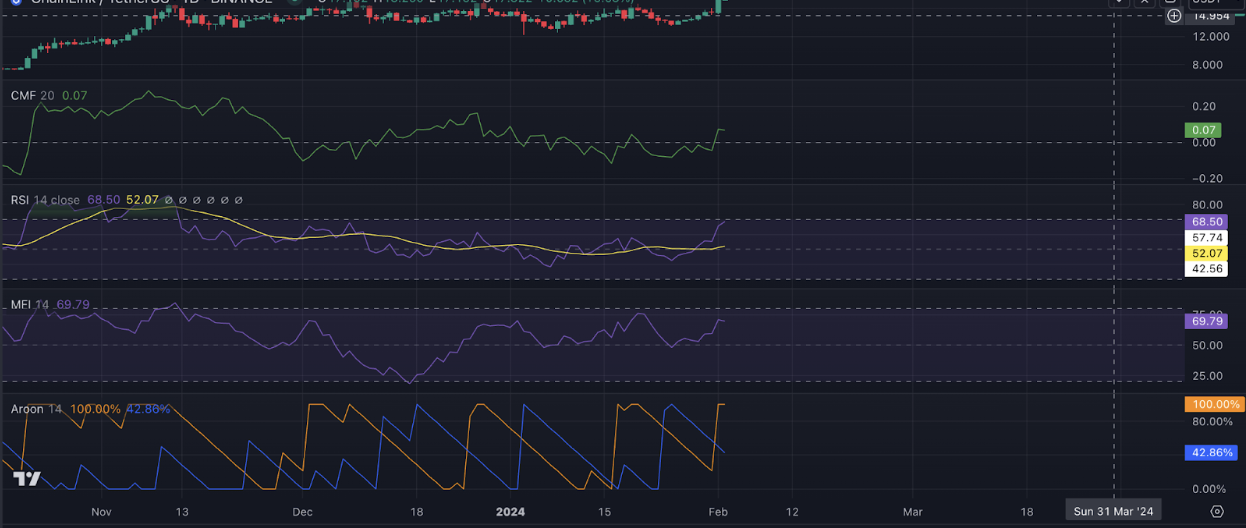
LINK/USDT 1-day chart
At the time of writing, the token’s weighted sentiment was 1.204. If this is maintained, LINK’s value may rise further before ultimately experiencing a correction.




