|

Chainlink price rise to $20 may be compromised by several technical indicators

  • Chainlink price is currently aiming to hit $20 after breaking out of an ascending parallel channel.
  • Several indicators are showing potential bearish signs in the short-term.

On November 21, Chainlink had a significant breakout above an ascending parallel channel with a lot of continuation from a low of $13.6 to a peak at $16.39 established on Tuesday. However, some bearish signs might stop LINK from climbing higher.

Chainlink facing a lot of selling pressure in the short-term

Despite the massive breakout of the ascending parallel channel, the TD Sequential indicator has just presented a sell signal on the daily chart for the first time since August 8, a validated signal.

link price

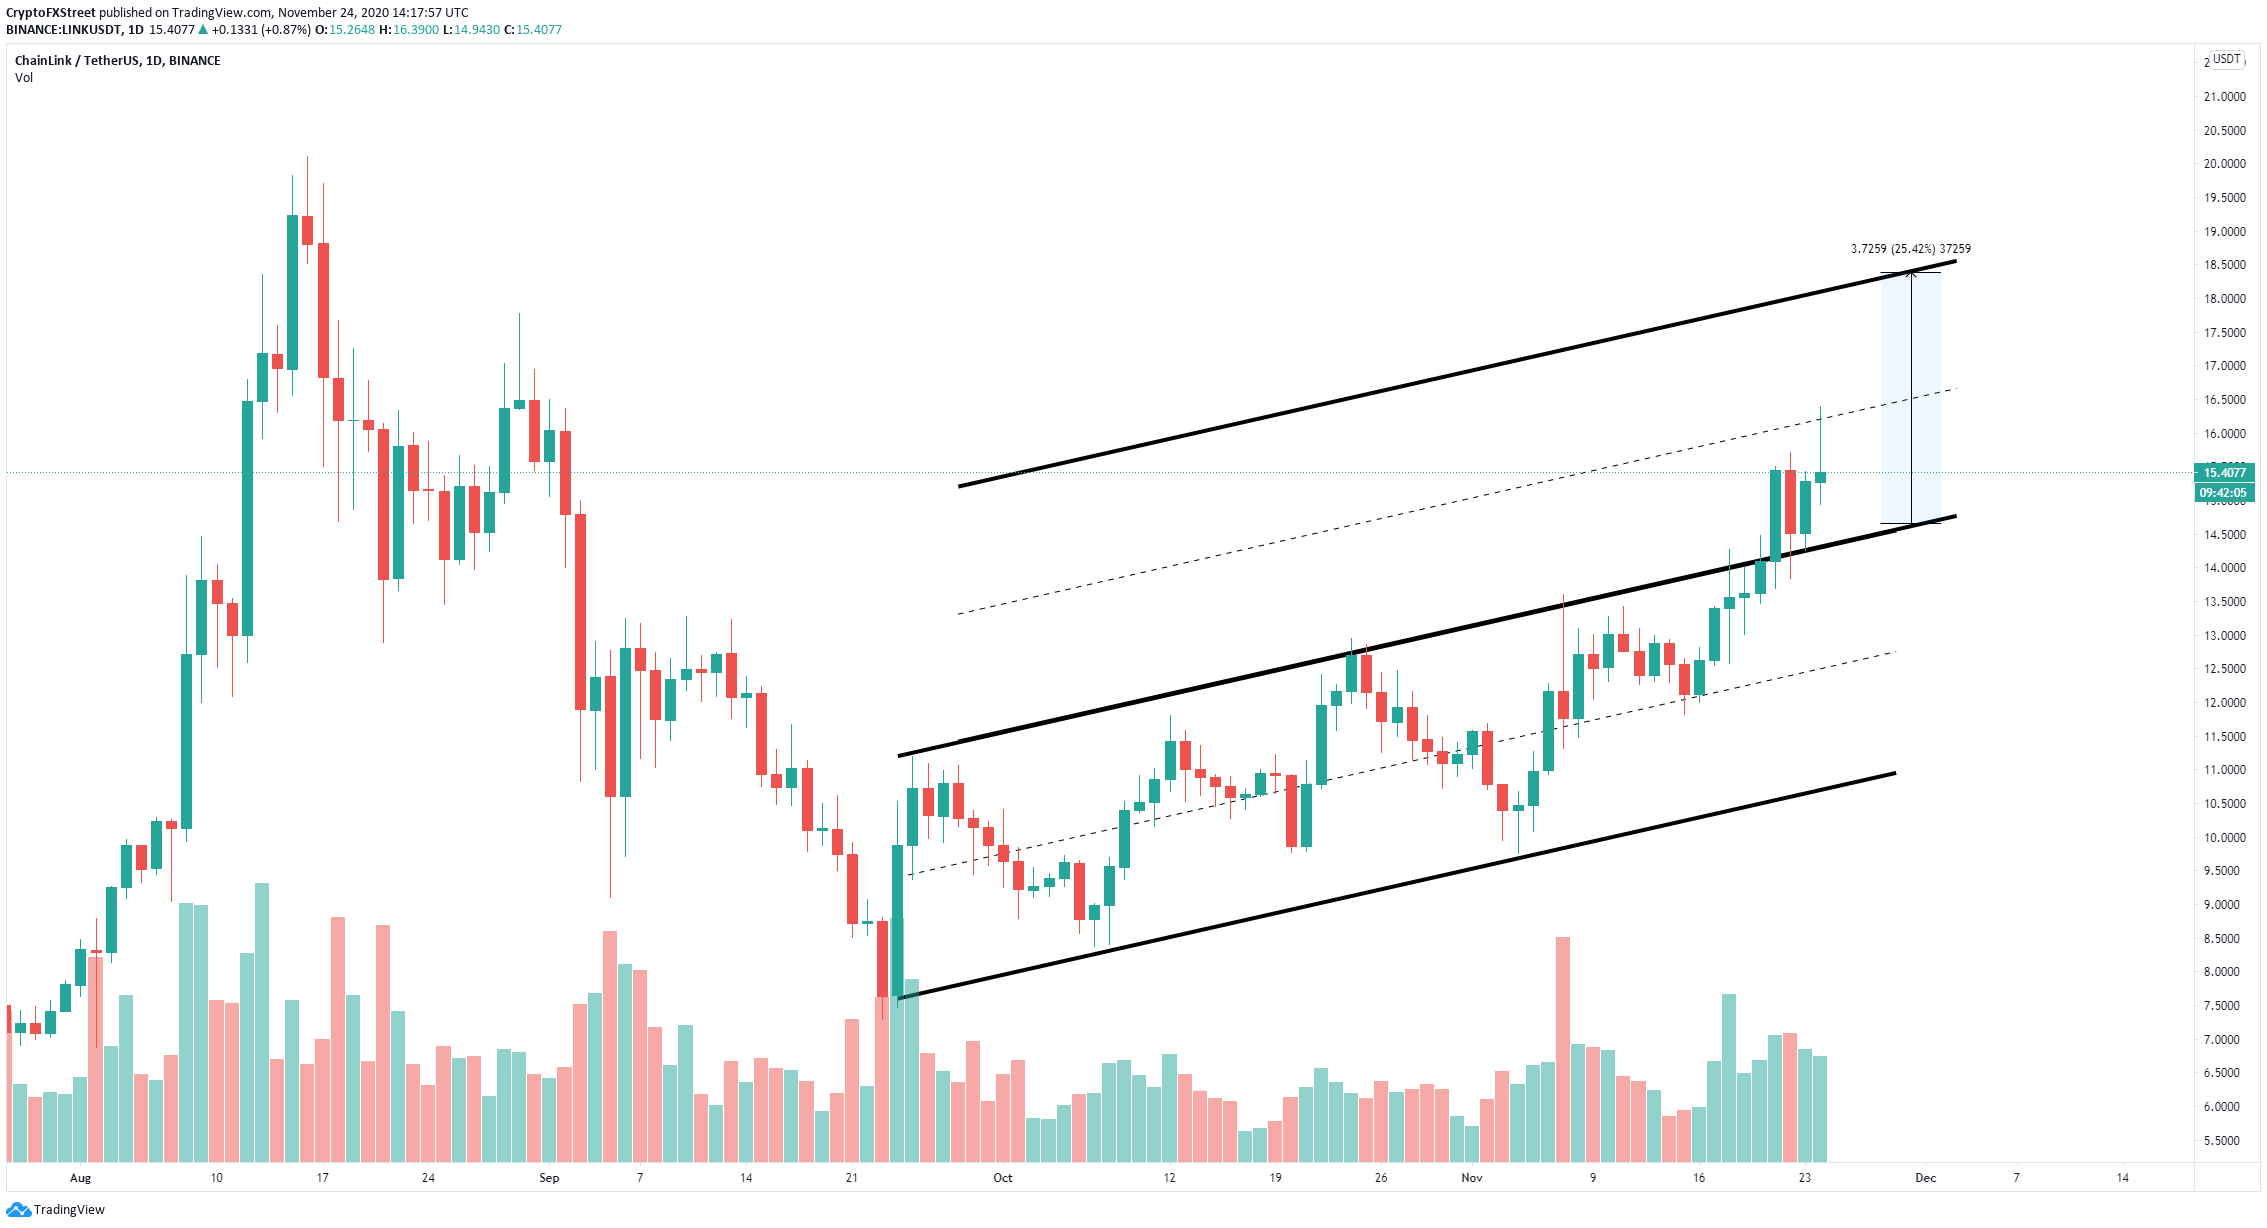
LINK/USD daily chart

Additionally, it seems that Chainlink price got significantly rejected from the peak at $16.39, dropping to a low of $14.94 and currently trading at $15.47. The digital asset could be looking at a re-test of the upper boundary of the channel at $14.4.

The In/Out of the Money Around Price (IOMAP) chart suggests something similar if selling pressure continues mounting. The most significant support area seems to be located between $14.73 and $15.17, where 10,310 addresses purchased close to 8 million LINK coins.
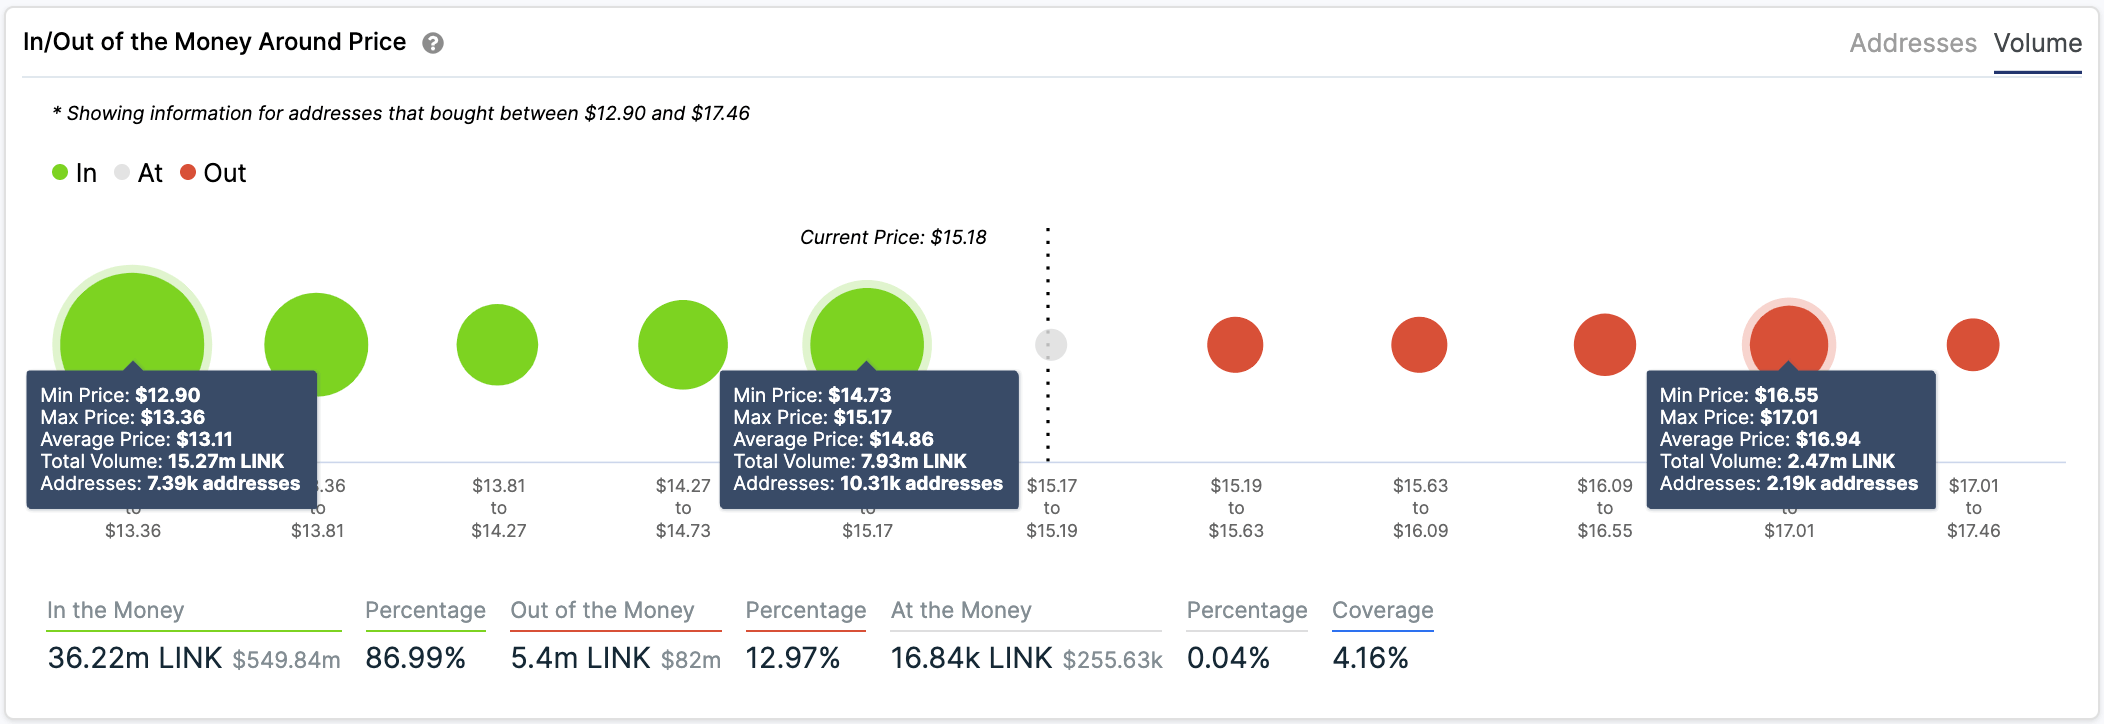
link price

LINK IOMAP chart

A breakdown below this area can drive Chainlink price towards the next area between $12.9 and $13.39. On the other hand, there seems to be very little resistance to the upside. The initial price target after the breakout of the ascending parallel channel was around $20. The IOMAP chart shows a small resistance area between $16.55 and $17.01. 

Author

Lorenzo Stroe

Lorenzo Stroe

Independent Analyst

Lorenzo is an experienced Technical Analyst and Content Writer who has been working in the cryptocurrency industry since 2012. He also has a passion for trading.

More from Lorenzo Stroe
Share:

Markets move fast. We move first.

Orange Juice Newsletter brings you expert driven insights - not headlines. Every day on your inbox.

By subscribing you agree to our Terms and conditions.

Editor's Picks

Ripple faces persistent bear risks, shrugging off ETF inflows

Ripple is extending its decline for the second consecutive day, trading at $2.06 at the time of writing on Friday. Sentiment surrounding the cross-border remittance token continues to lag despite steady inflows into XRP spot ETFs. 

Luna Classic soars 20% as Do Kwon's sentence hearing looms

Luna Classic surges 20% on Friday, extending its recovery for the fourth consecutive day. Roughly 959 million tokens have been burned in December so far, fueling LUNC's recovery.

Crypto Today: Bitcoin, Ethereum, XRP pare gains despite increasing hopes of upcoming Fed rate cut

Bitcoin (BTC) is steadying above $91,000 at the time of writing on Friday. Resistance at $94,150 capped recovery on Wednesday, but in the meantime, bulls have contained downside risks above $90,000. 

Ethereum strengthens against BTC post-Fusaka, targeting $3,200 breakout

Ethereum trades above $3,100 on Friday, with bulls aiming for a breakout above a two-month-old resistance trendline. Ethereum gains strength against Bitcoin as demand for the major altcoin increases after the Fusaka upgrade.

Orange Juice Newsletter – Smart insights by real people. Every day.

A free newsletter highlighting key market trends to help traders stay a step ahead. Daily insights on the most relevant trading topics, compiled by our experts in an easy-to-read format so you never miss an important move.

Bitcoin: BTC steadies as data suggests local bottom

Bitcoin (BTC) hovers around $91,000 at the time of writing on Friday, extending its recovery by 5% so far this week. On the institutional front, a modest outflow from US-listed spot Bitcoin Exchange Traded Funds (ETFs) marks a slowdown from previous weeks and signals a reduction in selling pressure, further supporting BTC’s recovery.