Chainlink Price Forecast: LINK targets $25 amid rising whale activity
- Chainlink records a nearly 2% increase on Thursday, fuelled by the increased capital flow and risk-on sentiment.
- Whale activity in Chainlink has increased with 25 million LINK tokens added to their holdings since February.
- The technical outlook suggests a potential bullish pattern breakout rally as sentiment improves.

Chainlink (LINK) trades higher at $16.45, up by over 2% at the time of writing on Thursday, mirroring the wider cryptocurrency market recovery, with Bitcoin hitting a new all-time high. On-chain data reveals rising support from whales, reinforcing the bullish sentiment. The technical outlook signals a potential inverted head and shoulders pattern breakout in LINK, adding further upside potential.
Chainlink targets $25 with a trend reversal pattern
Chainlink trades at $16.45 at the press time, building over the 2.48% jump on Wednesday. With the second positive candle, LINK exceeds the 200-day Exponential Moving Average (EMA) at $16.01, targeting a surge to the $18 supply zone.
The overhead zone at $18 keeps the LINK price within a high-volatility price range with a lower boundary at $10.93. However, the gradual surge in underlying bullishness leads to an inverted head-and-shoulders pattern in the daily chart, signalling a potential trend reversal.
The bullish pattern is highlighted in the technical chart below, with the ongoing price recovery aiming to form the right shoulder. A 40% bullish breakout target is calculated by extrapolating the pattern’s depth over the breakout point, targeting $25.34. Notably, this coincides with the 78.6% Fibonacci level, retraced over the 63% drop from $29.26 to $10.93 between December 15 and April 8.
The Relative Strength Index (RSI), at 58, takes off from the midline, signalling a surge in buying momentum. Moreover, the rising RSI shows room for growth as it maintains distance from the overbought zone.
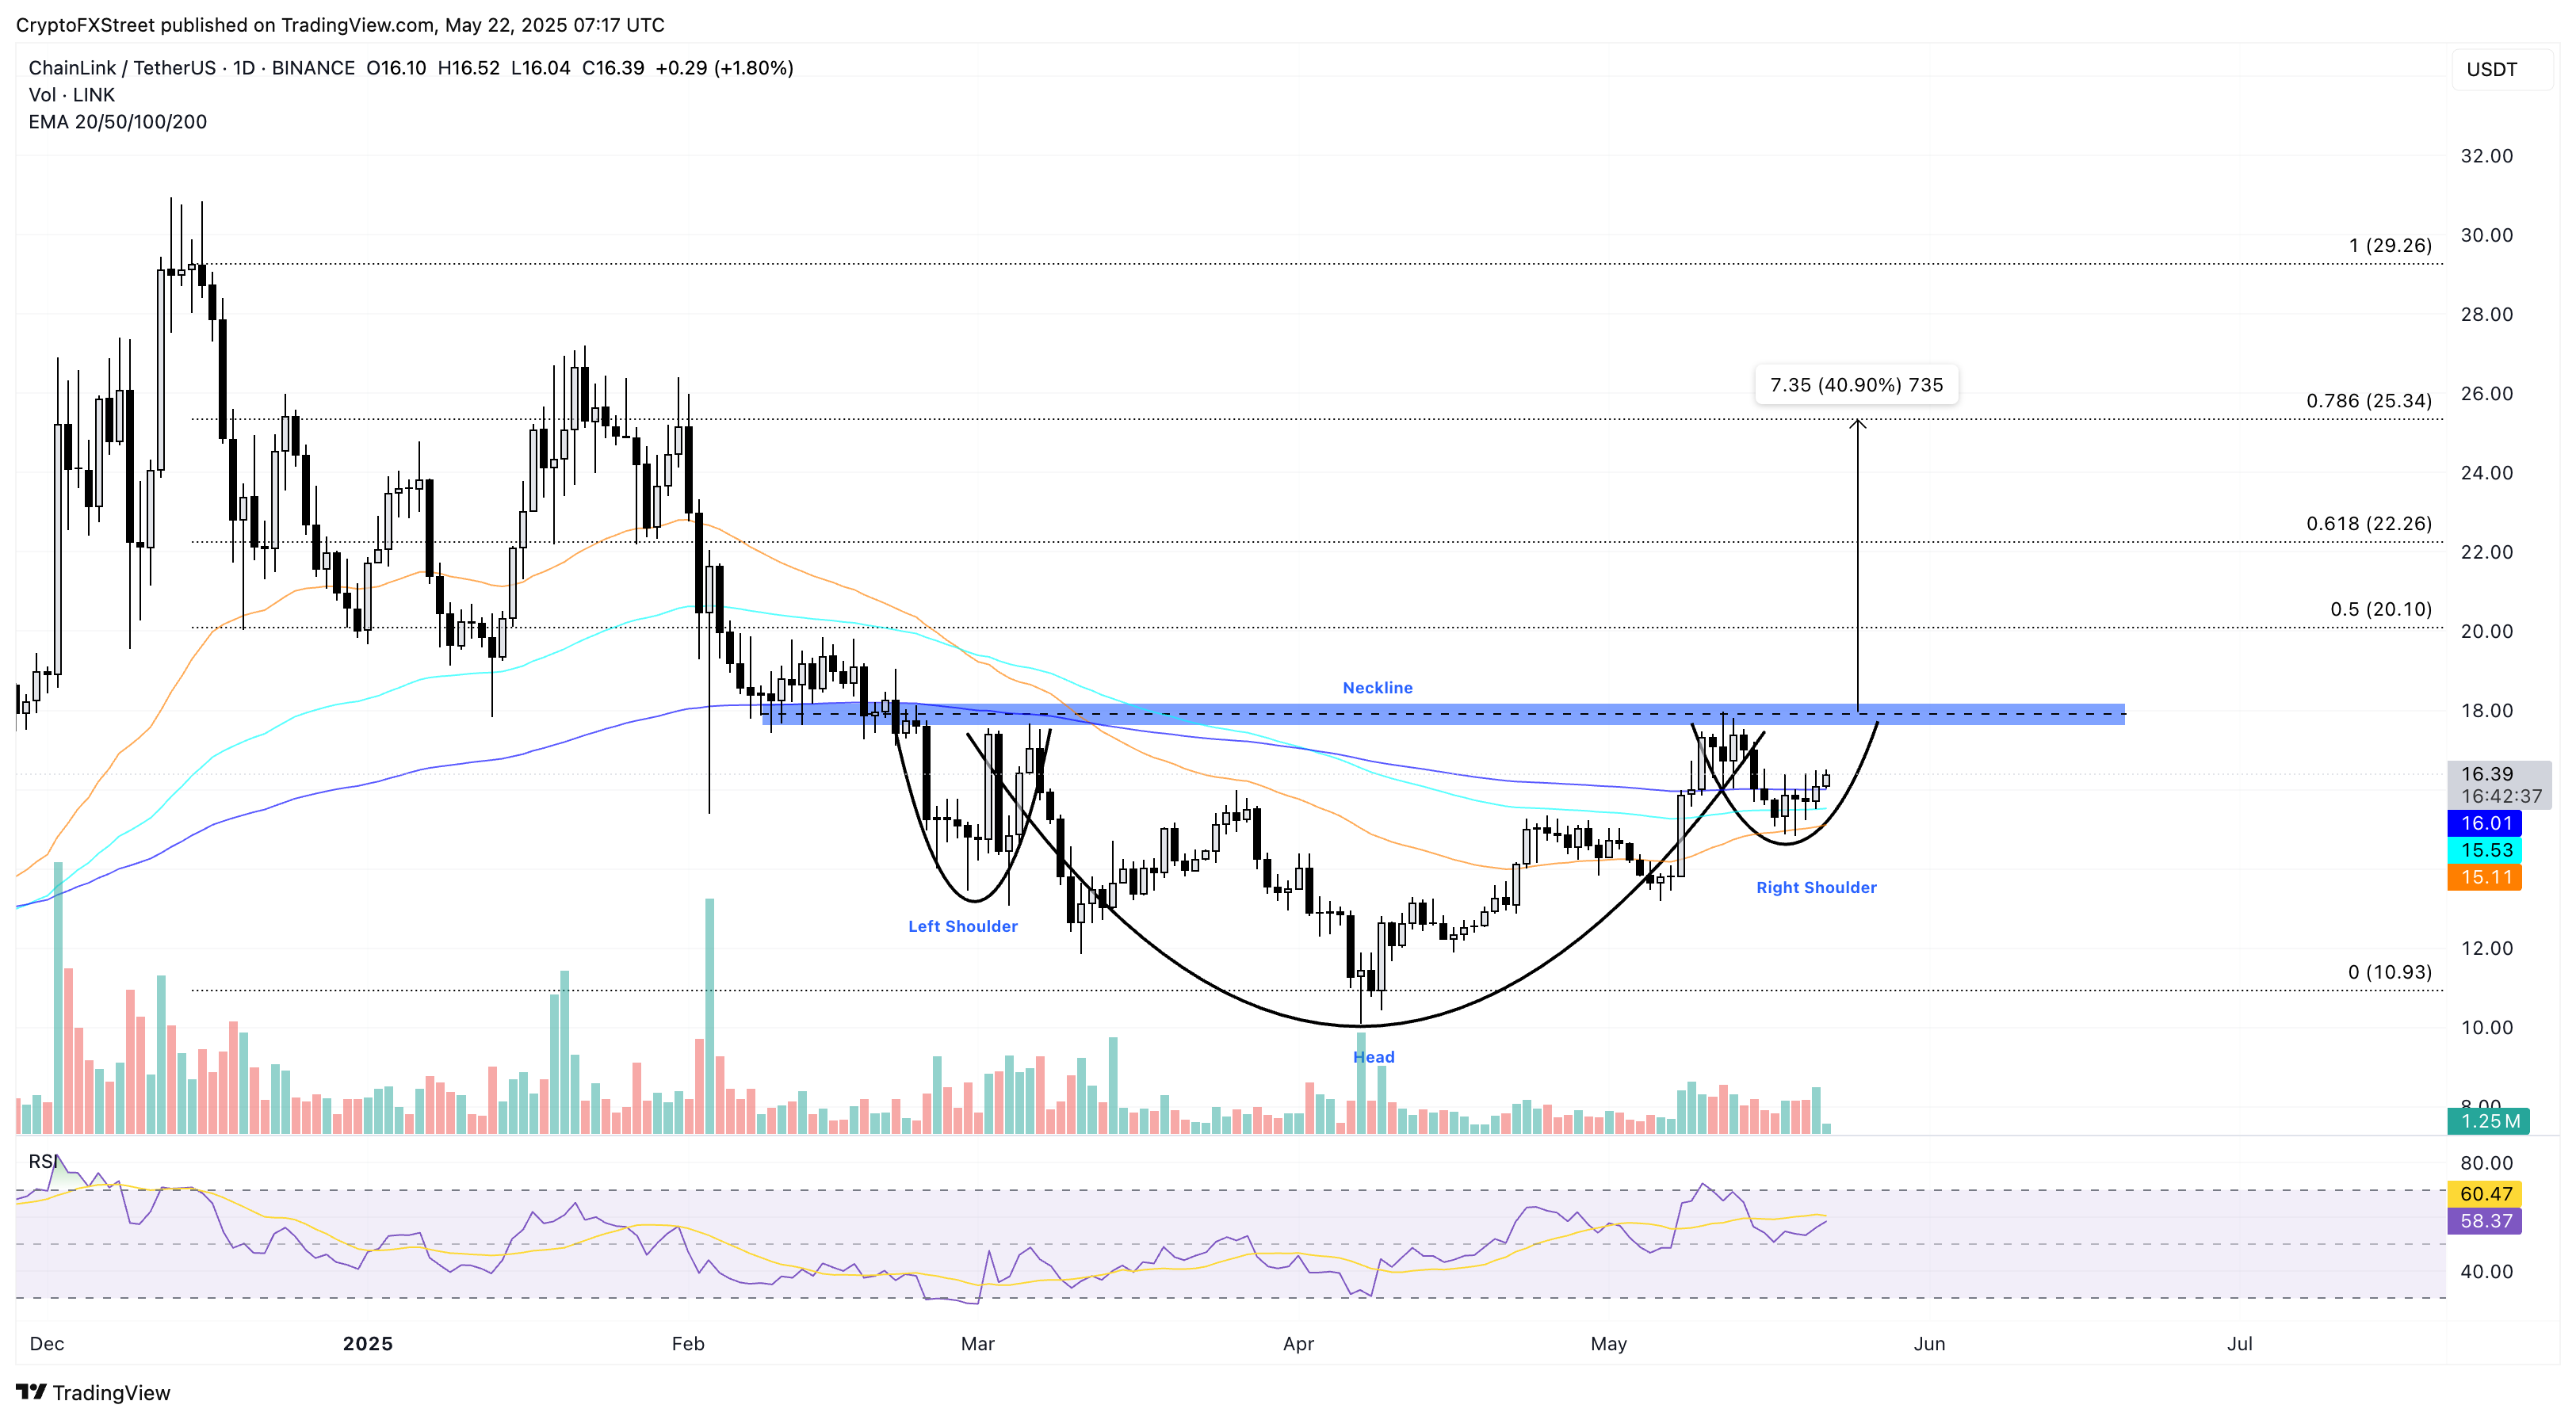
LINK/USDT price daily chart. Source: Tradingview
However, a reversal closing below the 50-day Exponential Moving Average (EMA), near the lower boundary of the right shoulder around $15.00, will invalidate the bullish pattern. This would extend the decline to $13.20, a previous higher low of the ongoing uptrend.
Whales’ activity supports LINK breakout chances
Optimistic whales have been on a buying spree as Chainlink has formed a reversal pattern since February. As per IntoTheBlock’s data, the balance by holding of investors with 100,000 to 10 million LINK tokens has witnessed a growth to 375 million from 350 million since February. The increased balance of large holders shows a growing confidence in Chainlink among smart investors.

LINK balance by holdings. Source: IntoTheBlock
Further up, the on-chain data platform highlights a spike in large transaction counts worth more than $100K. Such a large volume generally correlates with institutional or whale movement, as retail investors lack this much capital.

Number of large LINK transactions. Source: IntoTheBlock
Since May 17, the number of large transactions has increased to 228 from 97, a 135% increase. Thus, the increasing whale activity and holding support the bullish outlook on Chainlink.
Author

Vishal Dixit
FXStreet
Vishal Dixit holds a B.Sc. in Chemistry from Wilson College but found his true calling in the world of crypto.




