Chainlink Price Analysis: LINK on the verge of the abyss, bears have $8.6 in mind
- Chainlink is vulnerable to further losses after the sell-off below $10.5.
- The on-chain data confirms the bearish forecast as new addresses and whales decline.
-637336005550289133.jpg)
Chainlink (LINK), the 6th largest digital asset with the current market capitalization of $3.9 billion, has been losing ground since the weekend. The coin has lost nearly 13% in the last three days, and the downside momentum seems to be gaining traction on Wednesday.
At the time of writing, LINK/USD is changing hands at $10.1, down 1.7% on a day-to-day basis. The cryptocurrency is most popular on Binance and Huobi Global, while its average daily trading volume is registered at $1.4 billion, in line with the recent figures.
Chainlink is in a predicament
From the technical point of view, LINK has topped on approaching the psychological resistance of $13 and resumed the decline. After a short-lived consolidation at $11, the bearish momentum has gained traction and pushed the price below the critical support created by daily SMA50 at $10.5.
This barrier served as a formidable backstop for the price on numerous occasions in September and October. Now that it is out of the way, the sell-off may be extended with the next focus on the long-term barrier of $8.6 reinforced by the daily SMA200. Since April, the price has been trading above this SMA, meaning that it has the potential to stop the sell-off and trigger the recovery.
It is worth mentioning that if the selling pressure behind LINK is strong enough to push it below the $8.6 support, the downswing may be extended towards $6.5 (3-day SMA100) and $6 (weekly SMA50).
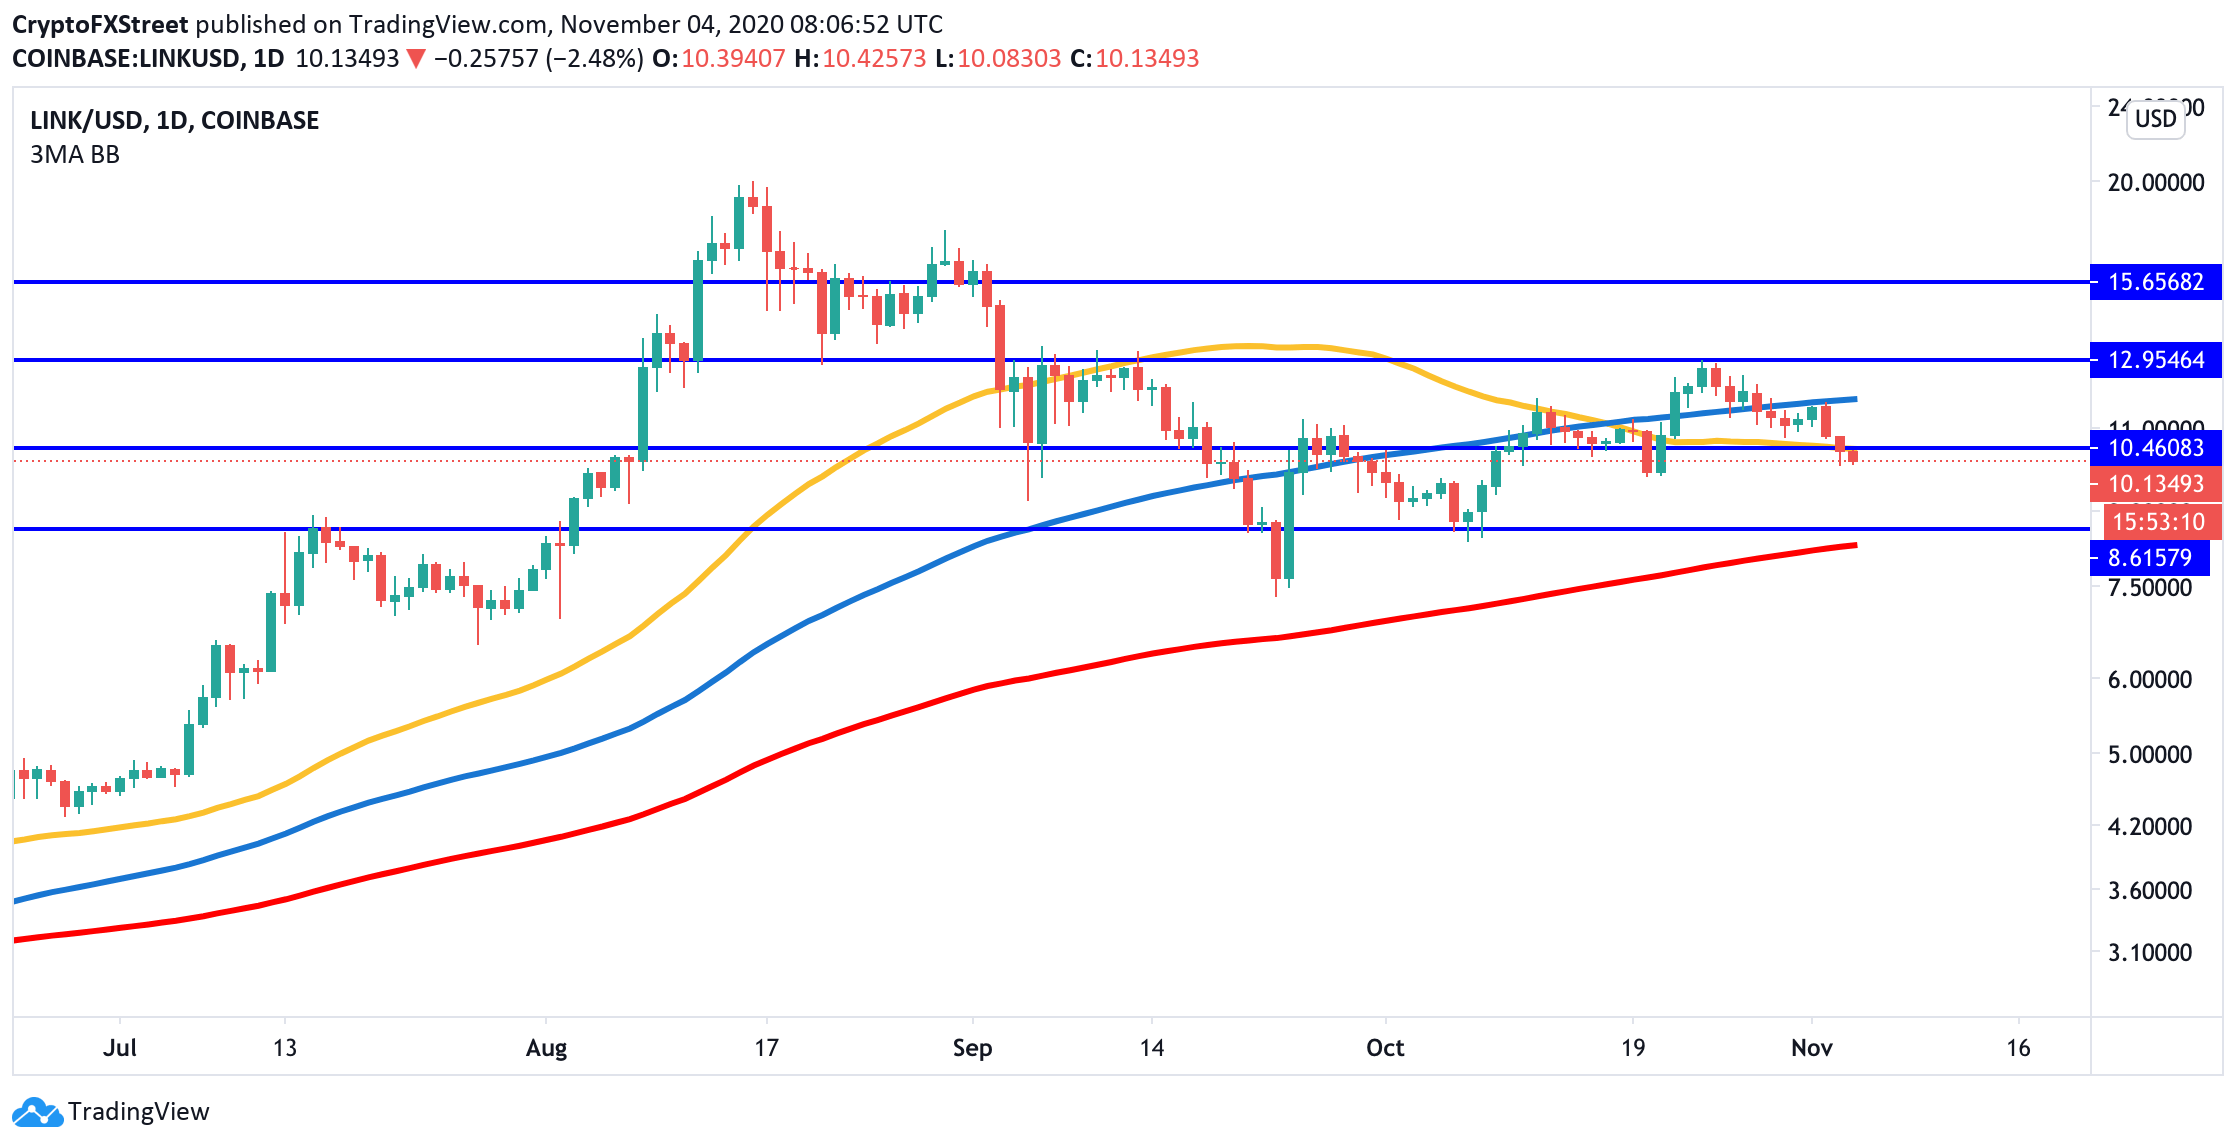
LINK/USD daily chart
A candlestick close above $10.5 will bring the focus back to $11.9 (daily SMA100) and $13. This barrier limited the recovery at the end of October and in September and may trigger the downside correction if LINK's bullish trend fails to gain momentum. A sustainable move above this area will invalidate the bullish scenario and bring $15.6 into focus.
A supply wall is seen on approach to $10.5
The current market positioning confirms the technical picture and implies that LINK is vulnerable to further sell-off at this stage.
IntoTheBlock's In/Out of the Money Around Price (IOMAP) signals that there is strong resistance between the current price and $10.5 as over 9,000 addresses are holding nearly 47 million coins there. Notably, there are no significant barriers above this area, so LINK could rally if this resistance is broken.
 Analytics and Charts-637400778146493555.png)
Chainlink's IOMP data (Source: Intotheblock)
Meanwhile, the way south is mostly clear as there are no meaningful supply areas below the current price, signaling that the downside is the path of the least resistance until at least $8.8.
Investors flee from network
The number of new addresses has barely changed in the past month, meaning the network is not growing. Approximately 2,000 addresses have been joining the network on a daily basis since the beginning of October 30. This number has plummeted from over 10,000 a day in August, representing an 80% decline.
The downward trend in network growth is an alarming signal for price growth in the near future. The lack of newly-created addresses tends to affect the regular inflow and outflow of tokens in the network and hence impact liquidity.
 Analytics and Charts1-637400778531377744.png)
Chainlink's new addresses (Source: Intotheblock)
Holder's distribution data shows that over 800 Chainlink holders with 1,000-10,000 in their wallets left the network since October 29. This is another red flag and a confirmation that investors are fleeing the network.
 [12.10.59, 04 Nov, 2020]-637400778742186895.png)
Chainlink's holders' distribution (Source: Santiment)
The sudden collapse is significant enough as these traders hold between $8 million to $80 million in LINK tokens in aggregate. A move of such a magnitude can have long-lasting consequences on the ecosystem.
Key levels to watch
To conclude, both technical and on-chain data imply that LINK/USD is vulnerable to the deeper sell-off towards the next critical support area of $8.6. This barrier should be able to slow down the bears; however, once it is cleared, the downside momentum will gain traction with the next focus on $6.5 and $6.
On the other hand, a sustainable move above $10.5 will improve the short-term technical picture and allow for an extended recovery towards $11.9 with the ultimate bullish target at $13. A move above this area is needed to invalidate the bearish scenario.
Author

Tanya Abrosimova
Independent Analyst


