Cardano Technical Analysis: ADA/BTC poised to resume the bull run
- The Cardano Foundation makes two key hires ahead of the transition to a fully decentralized protocol.
- ADA/BTC is nurturing the possibility of a bull run supported by both technical levels and on-chain metrics.

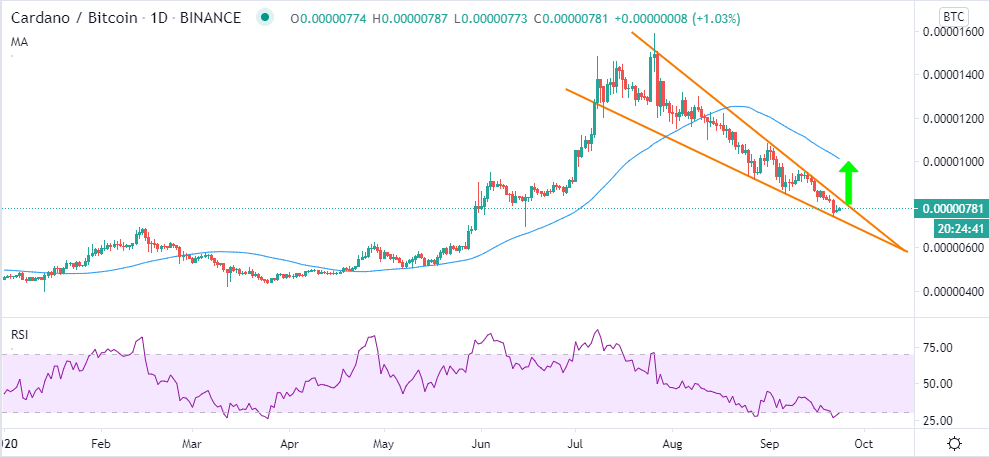
The ADA/BTC trading pair has been on a spiral since its yearly peak of 0.00001591 BTC on July 26. A lower high pattern emerged, limiting the pair under a descending trendline. ADA/BTC also dived beneath the 50 Moving Average in the 12-hour range, a move that intensified the selling pressure in August and September. At the time of writing, ADA/BTC is teetering at 0.0000078 BTC, following a shallow bounce from short term support established at 0.00000745 BTC.
Cardano Foundation hires blockchain experts in readiness for Goguen
The Cardano Foundation (CF) announced on September 21 that it has brought on board two world-class experts ahead of the vital Goguen era. An official statement by Bakyt Azimkanov, the Global PR and Communications Director at CF, said that Frederik Gregaard would become the first chief executive officer. At the same time, Eva Oberholzer comes on board as CF's inaugural head of growth.
Goguen is a term used to describe the Cardano network period to a fully decentralized protocol. Cardano's transition will introduce support for smart contracts, hence becoming a potential ‘Ethereum Killer.’ The development comes after Cardano launched Shelly, a new blockchain protocol that allows users to stake their ADA tokens and earn rewards.
ADA/BTC on the cusp of a descending wedge breakout
A descending wedge is drawing closer to a breakout on the daily chart. The ongoing reversal from the support mentioned above is highlighted by the Relative Strength Index (RSI). Suppose the indicator comes out of the oversold and sustains the uptrend towards the midline (50). In that case, the ADA/BTC pair will eventually breakout from the wedge, in turn shifting the focus to the critical 50-day EMA (0.00001 BTC).
ADA/BTC daily chart
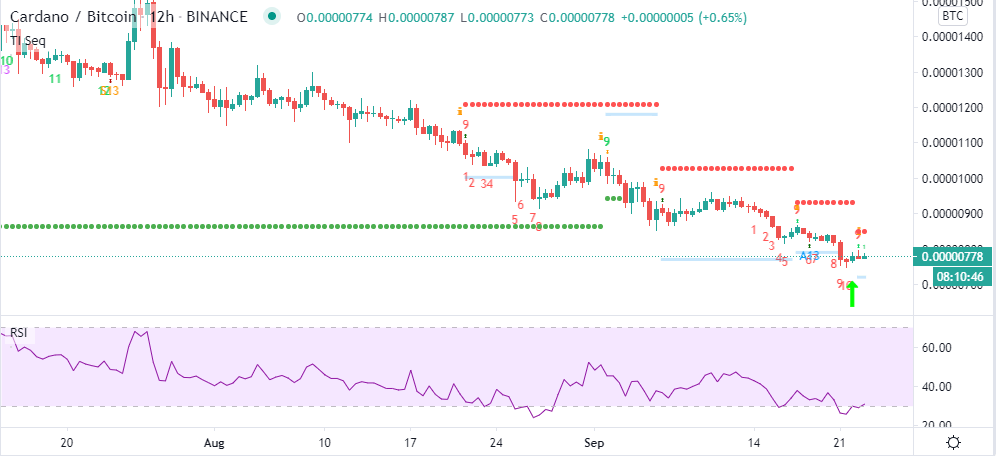
The TD Sequential Indicator recently presented a buy signal in the 12-hour timeframe, adding weight to the expected breakout. The bullish formation came into the picture following a red nine candlestick. An increase in buy orders will confirm the bullish scenario, especially if ADA/BTC closes above the short term resistance at 0.000008 BTC.
ADA/BTC 12-hour chart
A glance into Cardano’s on-chain metrics, particularly the new addresses joining the network, Cardano may be on its way to resuming the uptrend. Although the number of new daily addresses has maintained a downtrend since the beginning of September, a spike on September 21 suggests that a rebound is possible. This number rose from 4,170 a day to 5,950, representing a 30% growth. If the uptrend in the network growth is sustained in the coming weeks, then Cardano can comfortably start to rally.
New ADA daily addresses
-637364323941092743.png)
Looking at the other side of the picture
The ADA/BTC trading pair has a buy signal in both the daily and 12 hour timeframes. However, the resistance at 0.000008 BTC is not ready to give the bulls an easy pass for gains aiming for 0.00001 BTC. We must also wait for a buy signal on the weekly chart before going all-in on the ADA/BTC breakout.
ADA/BTC daily chart
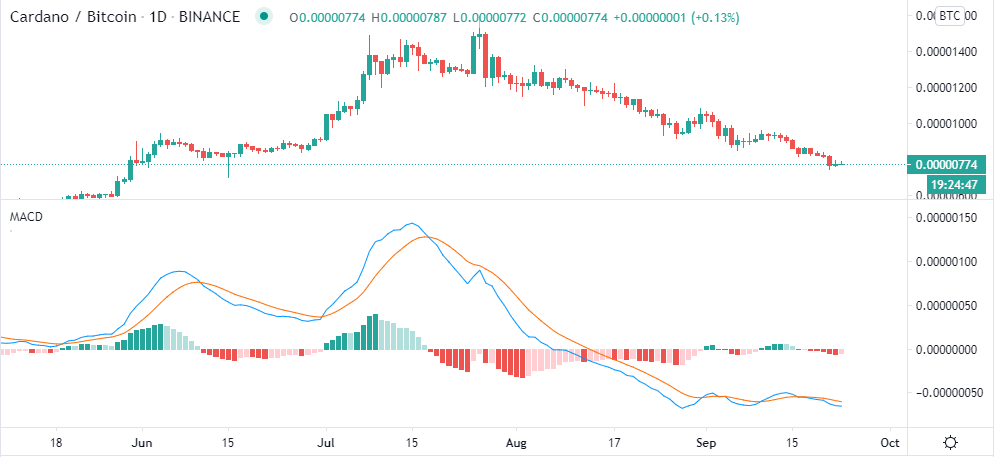
The Moving Average Divergence Convergence (MACD) suggests that price movement will not be rapid, at least for now. The indicator has just found bearing following an extended dive into the negative region. Moreover, a bearish divergence from the MACD hints that bearish pressure is still present. If short term support at 0.00000745 BTC caves in, ADA/BTC may extend the bearish leg further down.
Author

John Isige
FXStreet
John Isige is a seasoned cryptocurrency journalist and markets analyst committed to delivering high-quality, actionable insights tailored to traders, investors, and crypto enthusiasts. He enjoys deep dives into emerging Web3 tren


