Cardano Price Forecast: On-chain metrics and technical outlook signal bearish trend
- Cardano’s price was rejected by its ascending trendline pullback, suggesting a decline ahead.
- Artemis data shows decreasing daily trading volume, suggesting a fall in traders’ interest and liquidity in the ADA chain.
- A daily candlestick close above $0.367 would invalidate the bearish thesis.
Cardano (ADA) is trading slightly down around $0.33 on Monday, struggling against resistance from its previously broken ascending trendline. Declining daily trading volume reinforces a bearish outlook, indicating reduced trader interest and liquidity in the ADA chain.
Cardano shows signs of weakness
Cardano price broke and closed below the ascending trendline (drawn by joining multiple low levels since August ) on Friday, after rejection and declining 9.2% from the 50% price retracement level at $0.367 since Wednesday. It recovered slightly to retest the broken trendline and was rejected. On Monday, it declines slightly, trading around $0.332, facing resistance from the broken trendline at around $0.342.
If the $0.342 holds as resistance, ADA could decline over 9% to retest its September 6 low of $0.303.
The Relative Strength Index (RSI) indicator on the daily chart reads 42, below its neutral level of 50, indicating increasing bearish momentum.
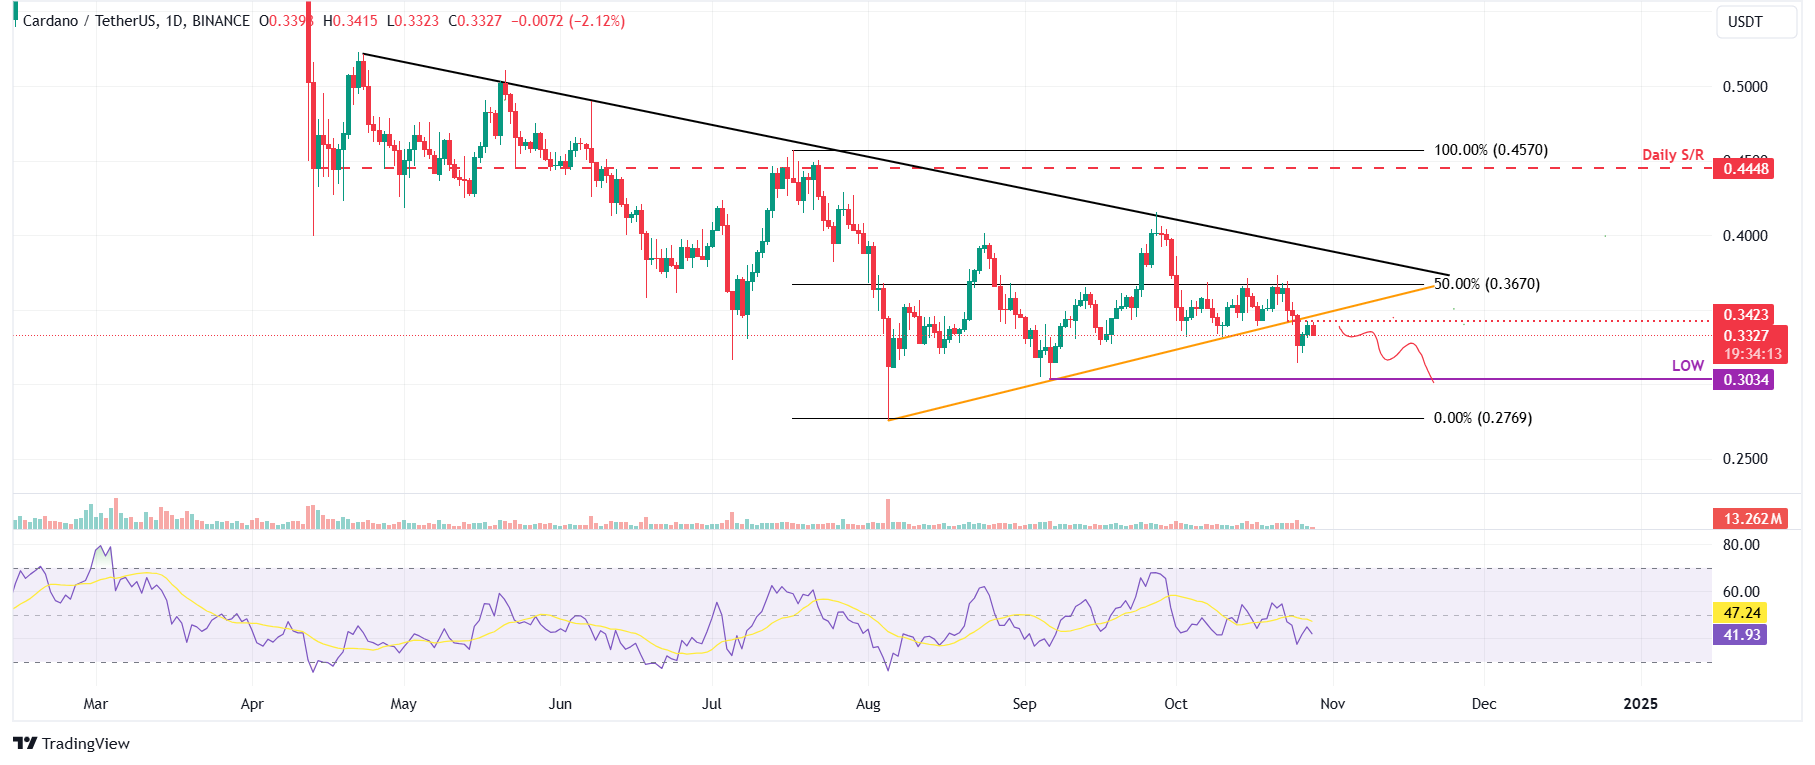
ADA/USDT daily chart
Based on IntoTheBlock’s In/Out of the Money Around Price (IOMAP), nearly 119,360 addresses accumulated 2.27 billion ADA tokens at an average price of $0.336. These addresses bought the tokens previously for between $0.332 and $0.341 and would likely sell them to get out at a breakeven price, which makes it a key resistance zone.
Interestingly, the zone mentioned from a technical analysis perspective, the $0.341 level, coincides with the IOMAP findings, making this zone a key reversal area to watch.
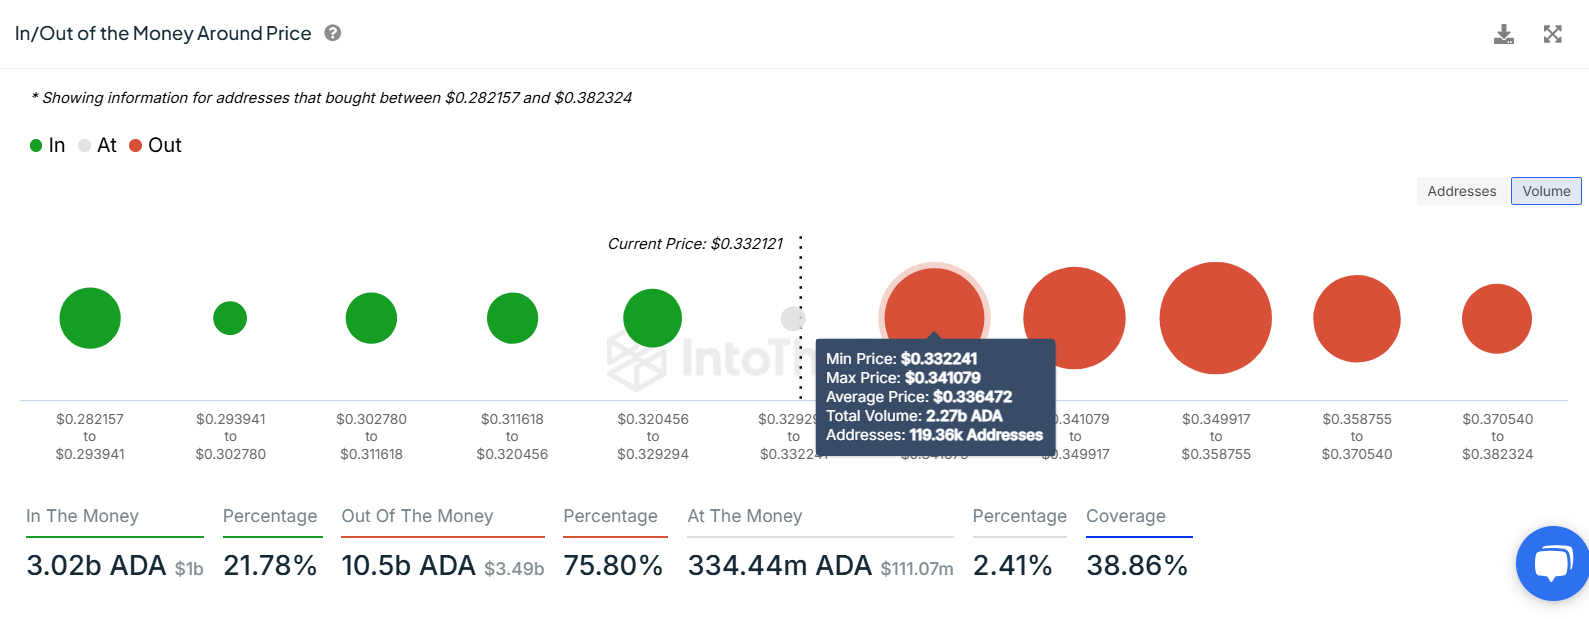
Cardano IOMAP chart. Source: IntoTheBlock
Another aspect bolstering the platform’s bearish outlook is a fall in traders’ interest and liquidity in the ADA chain. Artemis Terminal data shows that ADA’s daily trading volume fell from $545 million on Friday to $197 million on Sunday, the lowest level since early October and has been constantly declining since mid-February.
-638656921108702879.jpg)
ADA daily trading volume chart. Source: Artemis Terminal
However, the bearish thesis would be invalidated if ADA breaks and closes above the $0.367. This scenario could result in a rise in Cardano’s price to retest its September 27 high of $0.415.
Author

Manish Chhetri
FXStreet
Manish Chhetri is a crypto specialist with over four years of experience in the cryptocurrency industry.


