Cardano Price Forecast: Mixed signals cap ADA recovery
- Cardano price extends its decline on Friday after being rejected by the 50-day EMA earlier this week.
- Mixed derivatives metrics indicate traders' indecision, limiting the upside.
- The technical outlook remains neutral, with momentum indicators showing little directional bias.

Cardano (ADA) extends its decline, trading below $0.168 on Friday after facing rejection at the 50-day Exponential Moving Average (EMA) earlier this week. Mixed derivatives metrics indicate traders' indecision, while neutral momentum indicators suggest ADA lacks a catalyst for a sustained move in either direction.
Mixed positioning clouds ADA outlook
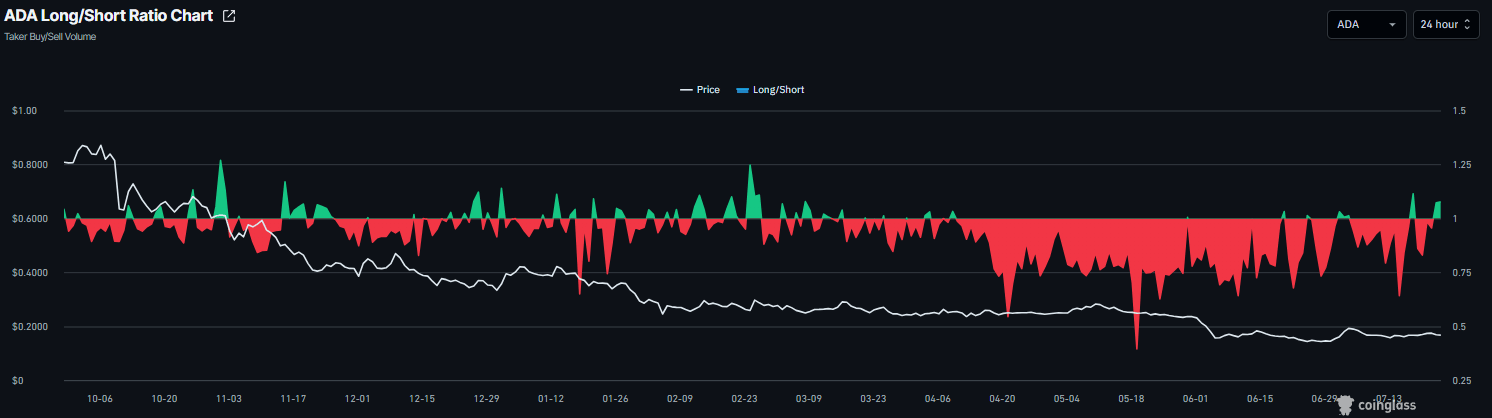
Derivatives data for Cardano show mixed sentiments among traders. CoinGlass’ long-to-short ratio for ADA read 1.07 on Friday. The ratio being above one, indicates bullish sentiment, as traders are betting the asset's price will rise.
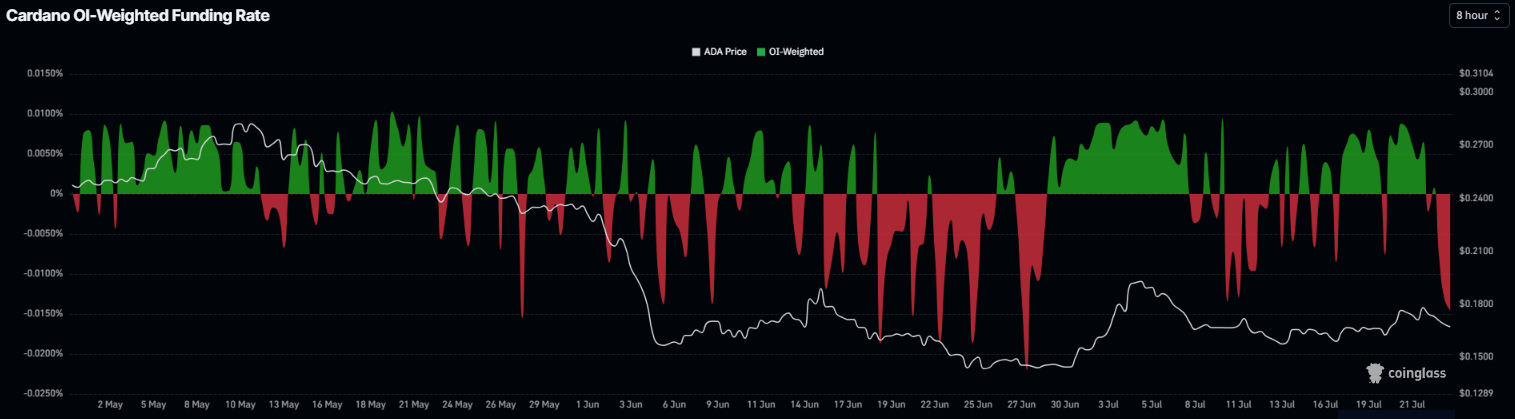
Meanwhile, the funding rates show a bearish bias. ADA funding rates flipped negative on Thursday, reading -0.014 on Friday, indicating that shorts are paying longs and signaling a negative outlook.
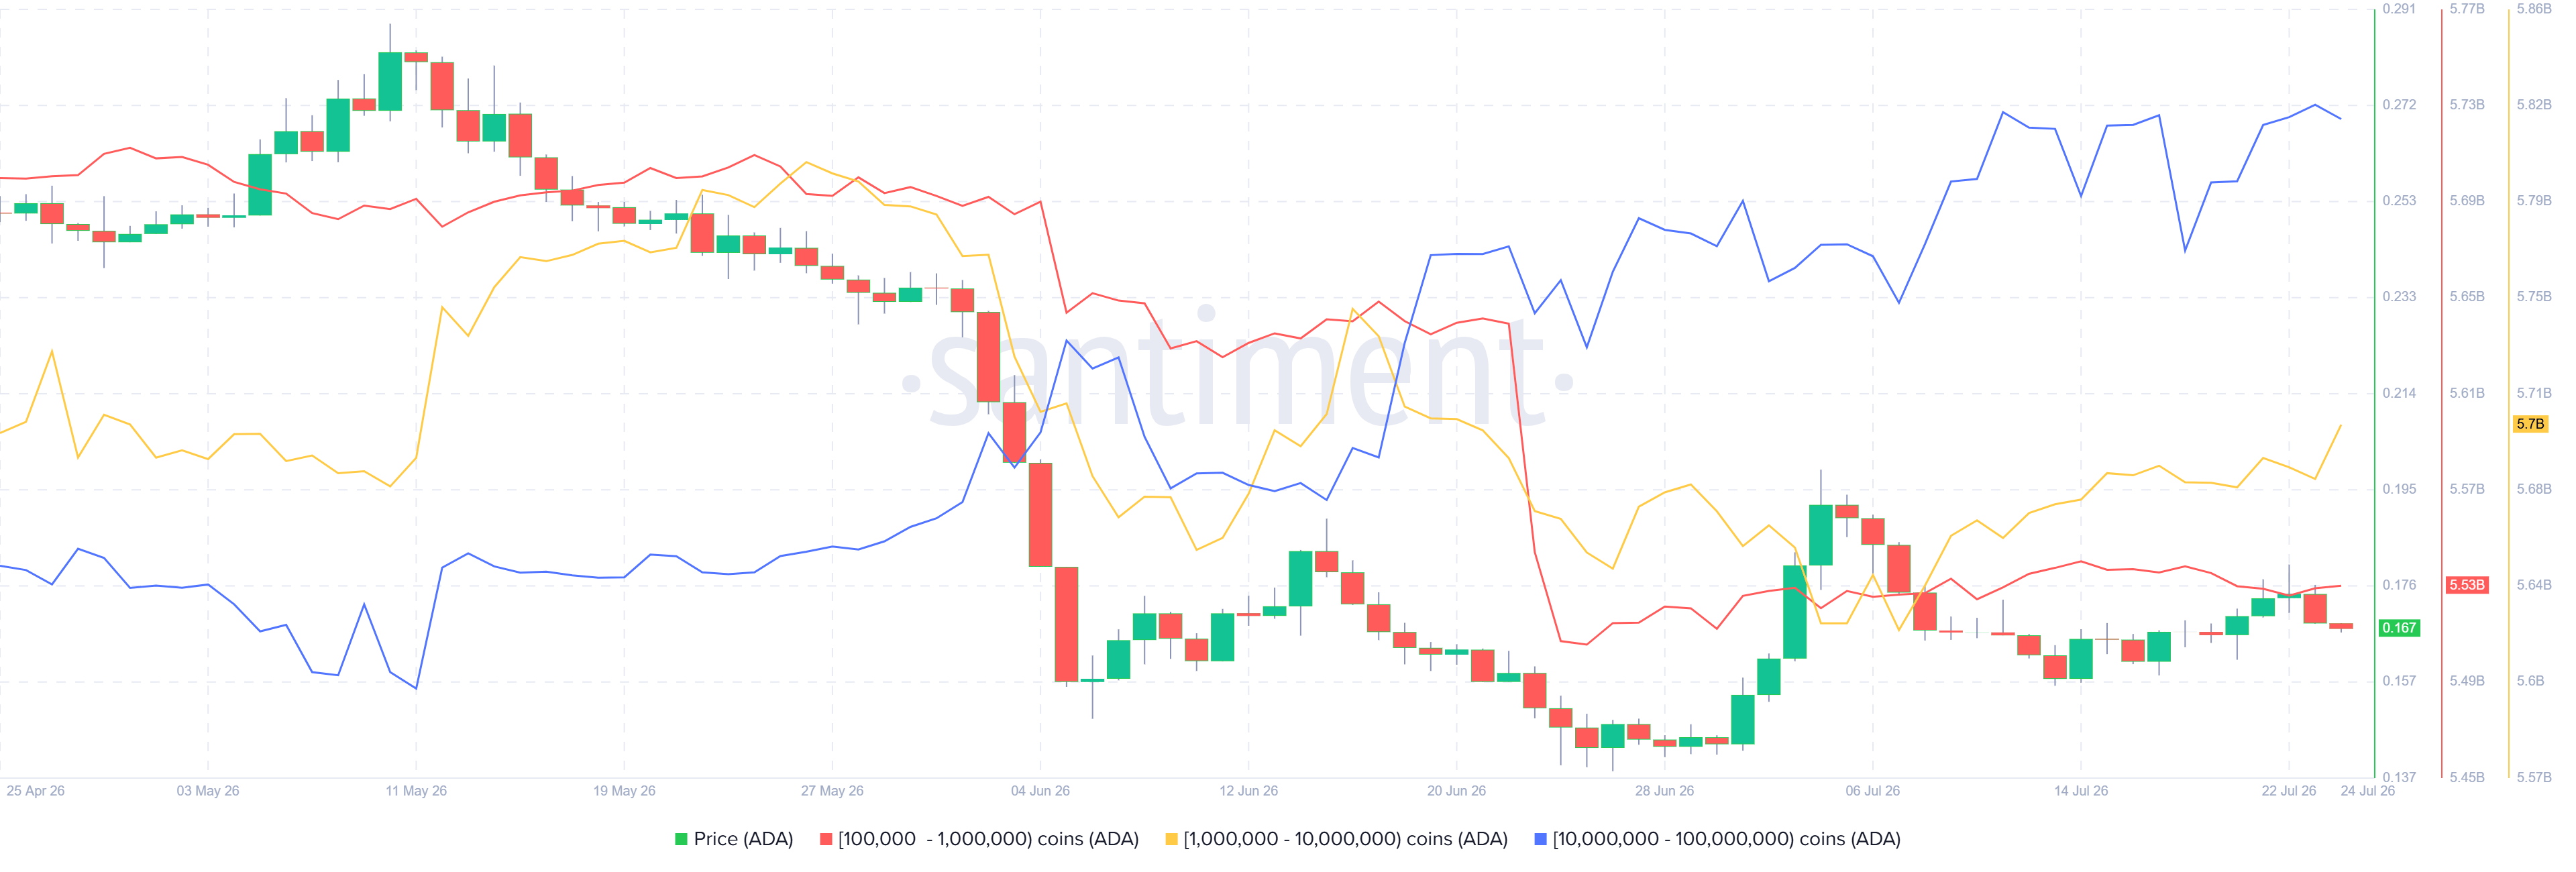
Santiment chart below shows that Cardano’s whales holding between 1 to 10 million (yellow line) and 10 to 100 million (blue line) ADA tokens have added 120 million ADA tokens since Monday, while wallets holding 100,000 to 1 million ADA remained largely inactive. This modest accumulation by larger holders suggests underlying buying interest but is not yet strong enough to confirm a bullish shift in sentiment.
Cardano Price Forecast: Bears defend the 50-day EMA
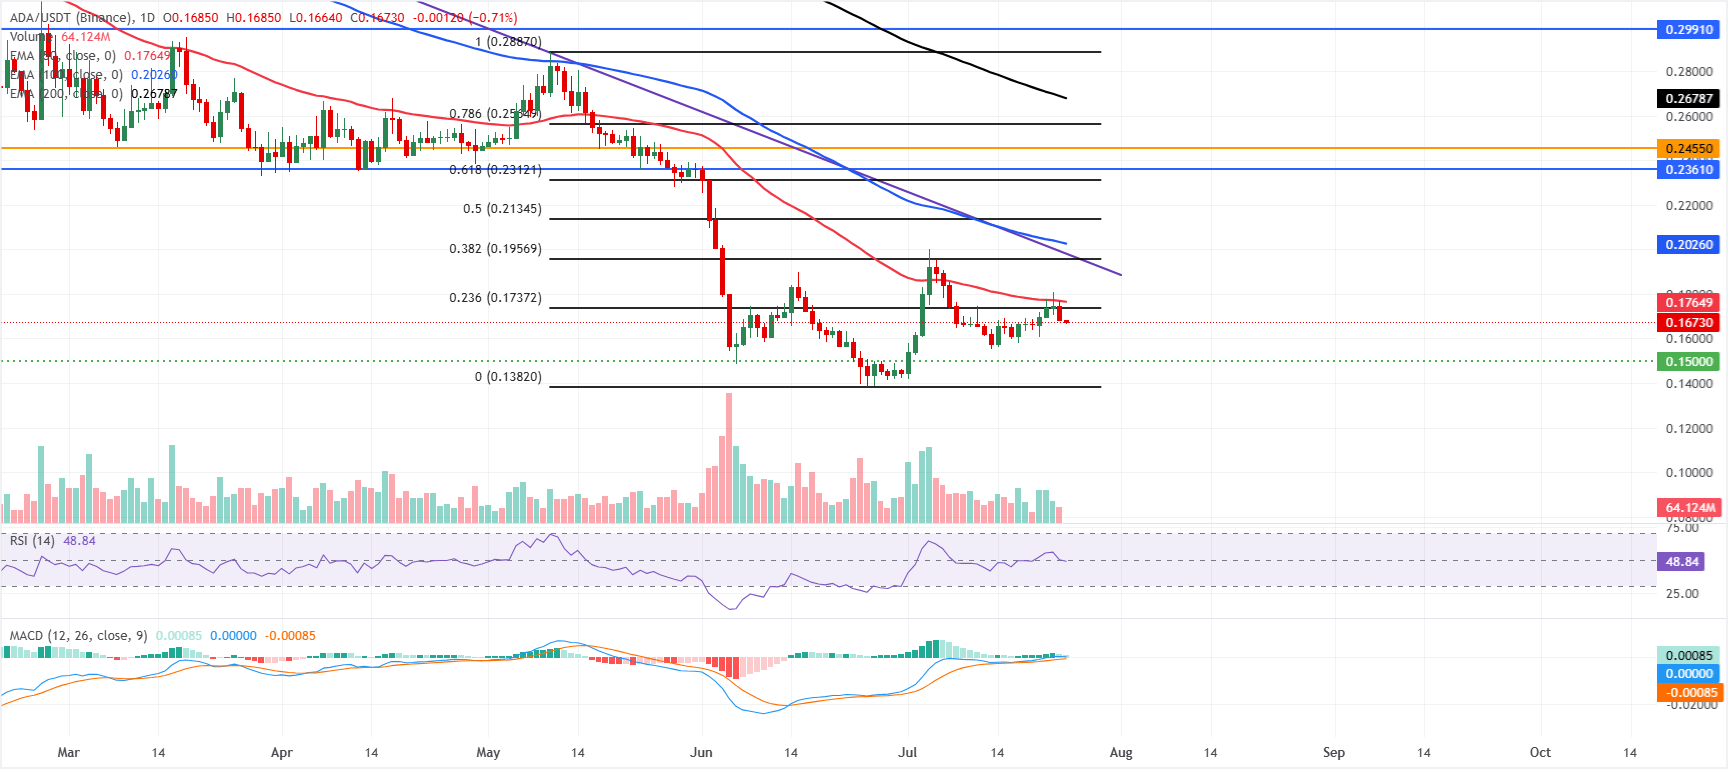
Cardano trades at $0.167 on Friday, holding in a bearish configuration as price remains below the 50-day, 100-day and 200-day Exponential Moving Averages (EMAs) at $0.176, $0.202 and $0.267 respectively.
The Relative Strength Index (RSI) around 48 is neutral, hinting at a lack of strong directional momentum. At the same time, the Moving Average Convergence Divergence (MACD) line stays modestly positive, suggesting only mild recovery attempts within a broader capped structure defined by the reclaimed long-term downtrend line, whose break level now acts as resistance at $0.197.
On the topside, immediate resistance appears at the 23.6% Fibonacci retracement at $0.173, closely followed by the 50-day EMA at $0.176; a sustained break above these would open the way toward the 38.2% Fibonacci retracement at $0.195, and the former trendline break around $0.197.
On the downside, initial support is seen at the horizontal level of $0.150 ahead of the Fibonacci anchor near $0.138, where failure to hold would expose fresh lower lows in the broader bearish cycle.
(The technical analysis of this story was written with the help of an AI tool. Know more.)
Author

Manish Chhetri
FXStreet
Manish Chhetri is a crypto specialist with over four years of experience in the cryptocurrency industry.



