Top 3 Price Predictions: Bitcoin, Ethereum, Ripple – BTC stalls near 50-day EMA, ETH extends losses, XRP struggles at key resistance
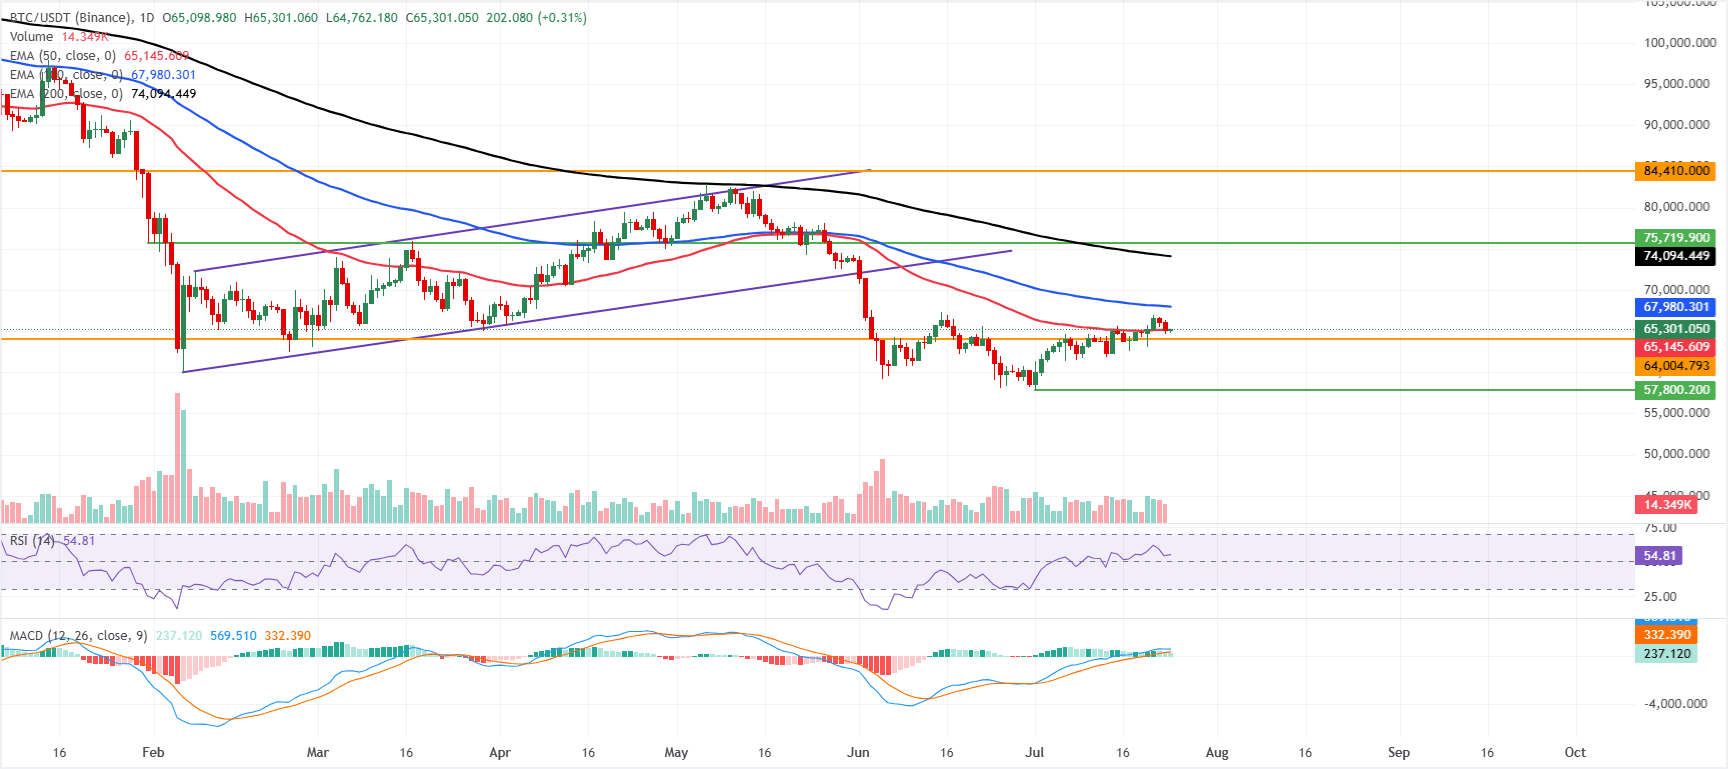
- Bitcoin hovers around the 50-day EMA at $65,145 on Friday after falling 2.70% in the previous two days.
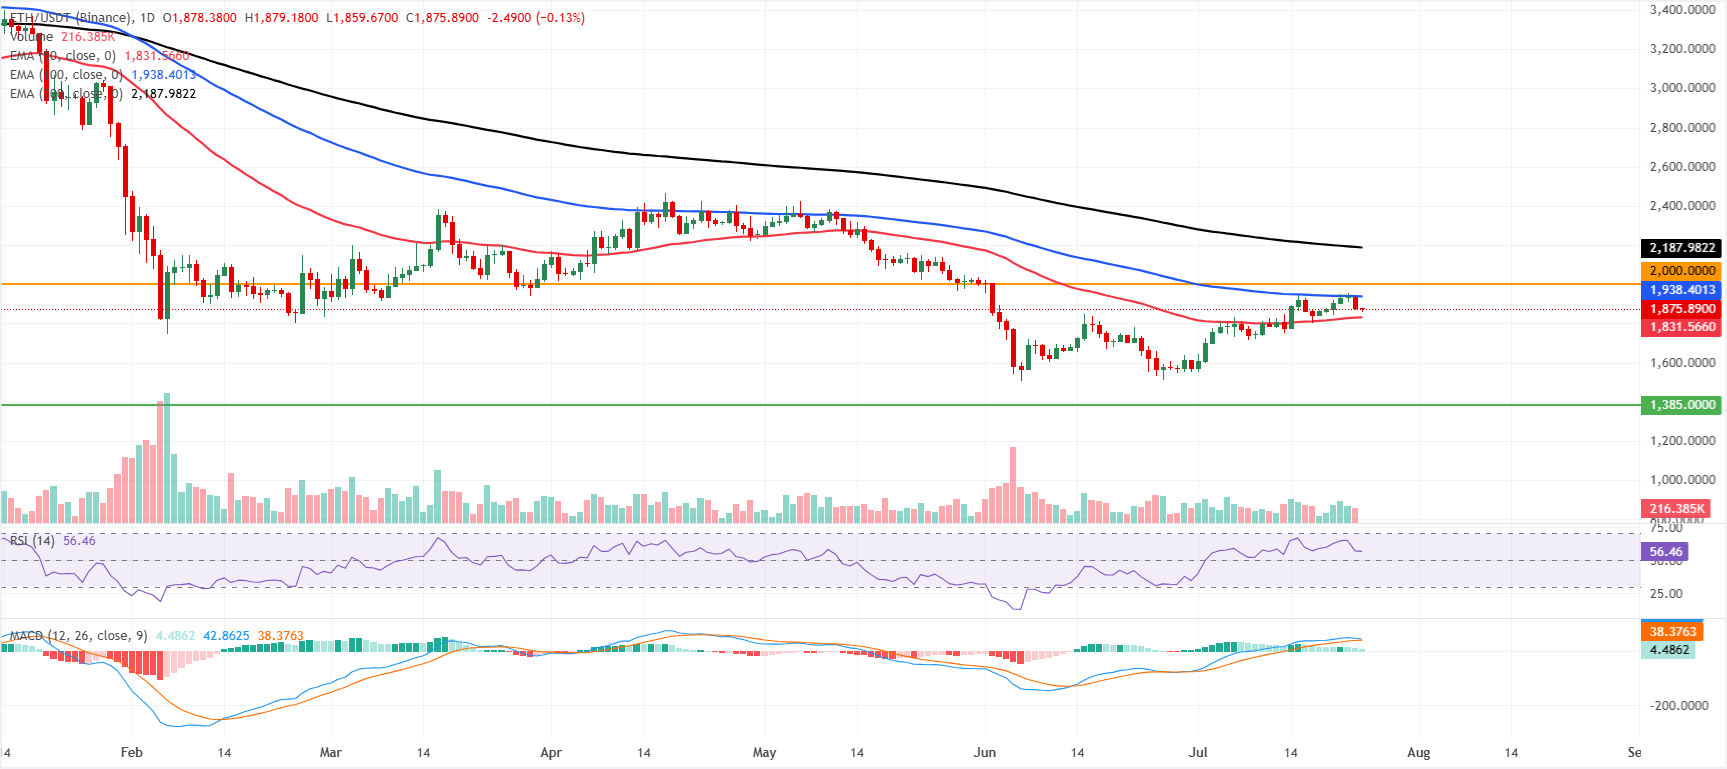
- Ethereum extends its correction after being rejected by the 100-day EMA.
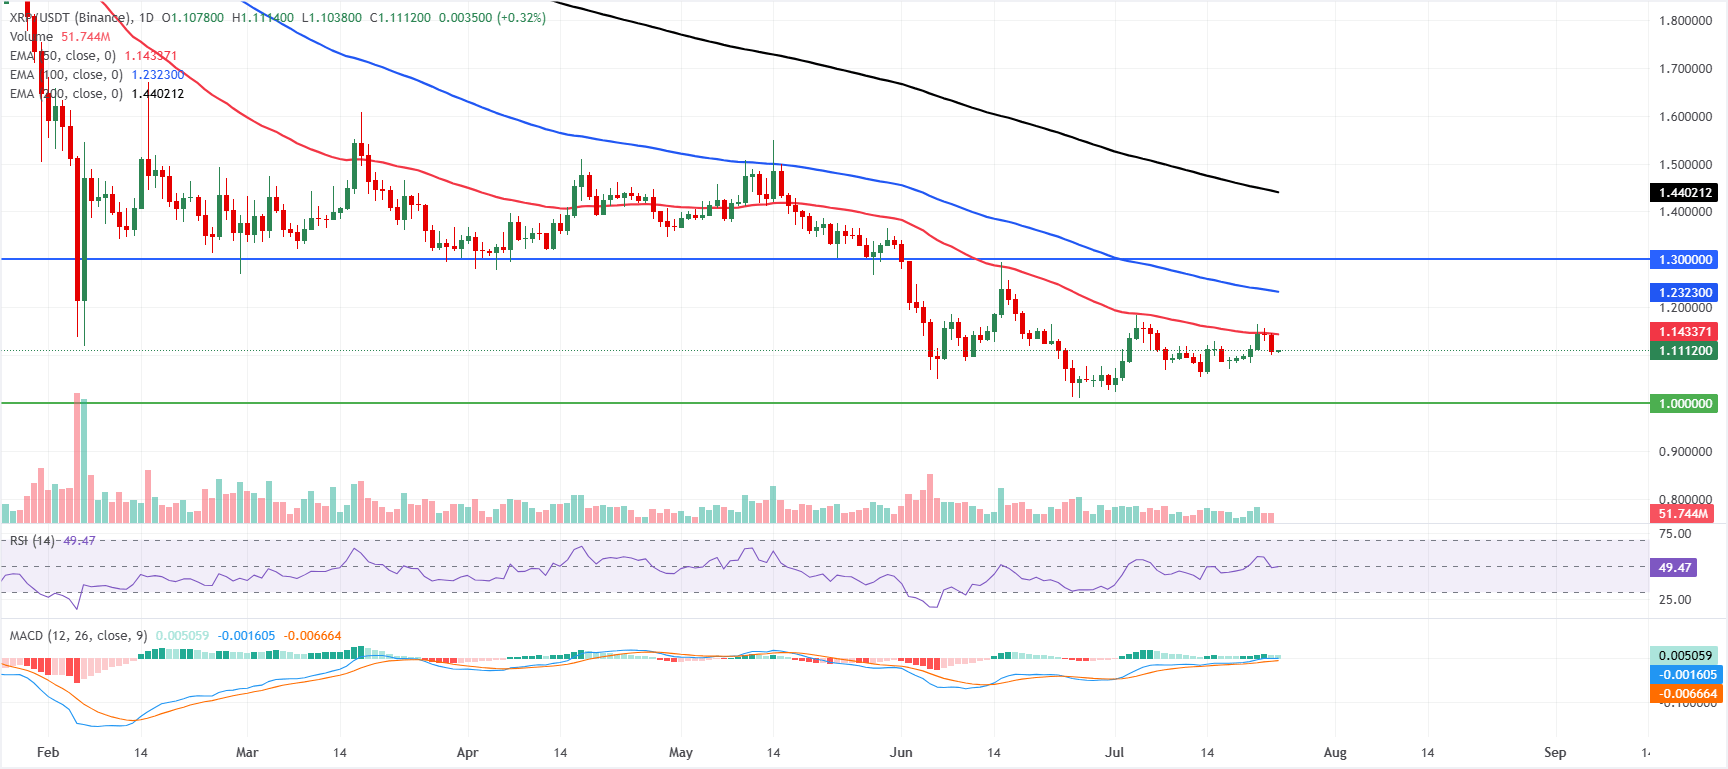
- XRP faces rejection at the 50-day EMA near $1.14, suggesting sellers remain in control.

Bitcoin (BTC) stalls near the 50-day Exponential Moving Average (EMA) at $65,145 after a mild correction earlier this week. Meanwhile, Ethereum (ETH) and Ripple (XRP) face rejection at key resistance levels, keeping the short-term technical outlook bearish.
Bitcoin could recover if 50-day EMA holds as support
Bitcoin price trades at $65,300 on Friday, with a neutral-to-slightly bullish near‑term tone as spot action holds just above the 50‑day Exponential Moving Average (EMA) at $65,145 while still trading beneath the 100‑day and 200‑day EMAs at $67,980 and $74,094, respectively. This configuration suggests the bounce from the recent base is gaining traction but remains a corrective move within a broader capped structure.
The Relative Strength Index (RSI) at around 54 points to steady, non‑overbought upside momentum, while the positive Moving Average Convergence Divergence (MACD) reading above the zero line suggests bullish pressure is improving but not yet strong enough to challenge the higher daily trend barriers.
On the downside, immediate support is located at the reclaimed 50‑day EMA near $65,145, with a stronger demand zone emerging at the prior horizontal floor around $64,004 if sellers regain control.
On the topside, initial resistance is seen at the 100‑day EMA clustered near $67,980, ahead of the more decisive medium‑term hurdle at the 200‑day EMA around $74,094; a sustained break above these levels would be needed to reopen the path toward the distant horizontal resistance at $84,410.
Ethereum faces rejection from the 100-day EMA
Ethereum price trades at $1,875 on Friday and holds above the 50-day EMA at $1,831, hinting at a modestly constructive short-term tone, but remains capped beneath the 100-day EMA at $1,938 and the distant 200-day EMA at $2,187, which keep the broader recovery in check.
The RSI at 56 sits in positive but non-extreme territory. At the same time, the MACD remains in positive territory, together suggesting steady but not explosive bullish momentum as long as price holds above the 50-day EMA.
On the topside, immediate resistance is at the 100-day EMA near $1,938, with a break there exposing the psychological horizontal barrier at $2,000, then the 200-day EMA at $2,188.
On the downside, initial support is provided by the 50-day EMA around $1,831, ahead of a more distant structural floor at $1,385, where buyers would be expected to re-emerge on a deeper pullback.
XRP sits below key EMAs
XRP price trades at $1.111 on Friday, holding a bearish near-term bias as it sits below the 50-, 100-, and 200-day EMAs clustered overhead. The 50-day EMA at $1.143 is the nearest dynamic cap, with the longer 100-day EMA at $1.232 and the 200-day EMA at $1.440 reinforcing a broader downside structure, even as the RSI hovers near a neutral 49, and the MACD remains marginally positive, hinting at only modest countertrend buying interest.
On the topside, initial resistance is at the 50-day EMA near $1.143, followed by the 100-day EMA near $1.232; a stronger recovery would face further hurdles at the $1.300 horizontal barrier, ahead of the 200-day EMA at $1.440 and the distant $1.900 resistance line.
On the downside, the first significant support emerges at the $1.000 psychological and horizontal level, where bulls would be expected to defend the broader range if selling pressure resumes.
(The technical analysis of this story was written with the help of an AI tool. Know more.)
Cryptocurrency metrics FAQs
The developer or creator of each cryptocurrency decides on the total number of tokens that can be minted or issued. Only a certain number of these assets can be minted by mining, staking or other mechanisms. This is defined by the algorithm of the underlying blockchain technology. On the other hand, circulating supply can also be decreased via actions such as burning tokens, or mistakenly sending assets to addresses of other incompatible blockchains.
Market capitalization is the result of multiplying the circulating supply of a certain asset by the asset’s current market value.
Trading volume refers to the total number of tokens for a specific asset that has been transacted or exchanged between buyers and sellers within set trading hours, for example, 24 hours. It is used to gauge market sentiment, this metric combines all volumes on centralized exchanges and decentralized exchanges. Increasing trading volume often denotes the demand for a certain asset as more people are buying and selling the cryptocurrency.
Funding rates are a concept designed to encourage traders to take positions and ensure perpetual contract prices match spot markets. It defines a mechanism by exchanges to ensure that future prices and index prices periodic payments regularly converge. When the funding rate is positive, the price of the perpetual contract is higher than the mark price. This means traders who are bullish and have opened long positions pay traders who are in short positions. On the other hand, a negative funding rate means perpetual prices are below the mark price, and hence traders with short positions pay traders who have opened long positions.
Author

Manish Chhetri
FXStreet
Manish Chhetri is a crypto specialist with over four years of experience in the cryptocurrency industry.




