Cardano Price Forecast: ADA targets wedge breakout as bullish bets rise, $8.57 million in shorts at risk
- Cardano edges higher, regaining bullish momentum within a falling wedge pattern.
- Long positions in ADA derivatives increased in the past day, indicating a bullish inclination among traders.
- Short positions worth over $8.50 million are at risk of liquidating as ADA approaches $0.80.

Cardano (ADA) edges higher by nearly 3% at press time on Thursday, inching closer to the $0.8000 level. The derivatives data indicate an increase in long positions, putting $8.57 million of short positions at risk, while the technical outlook suggests ADA could continue to rise within a wedge pattern.
Cardano bears at risk as bullish bets surge
CoinGlass’ data shows the ADA long-to-short ratio chart rising to 1.0421, with 51.03% long positions, up from 0.9223 with 47.98% long positions on Wednesday. The ratio stands at the highest level since July 9.
This increase in long positions, along with the ratio swinging above the threshold of 1, reflects heightened bullish sentiment among ADA traders.
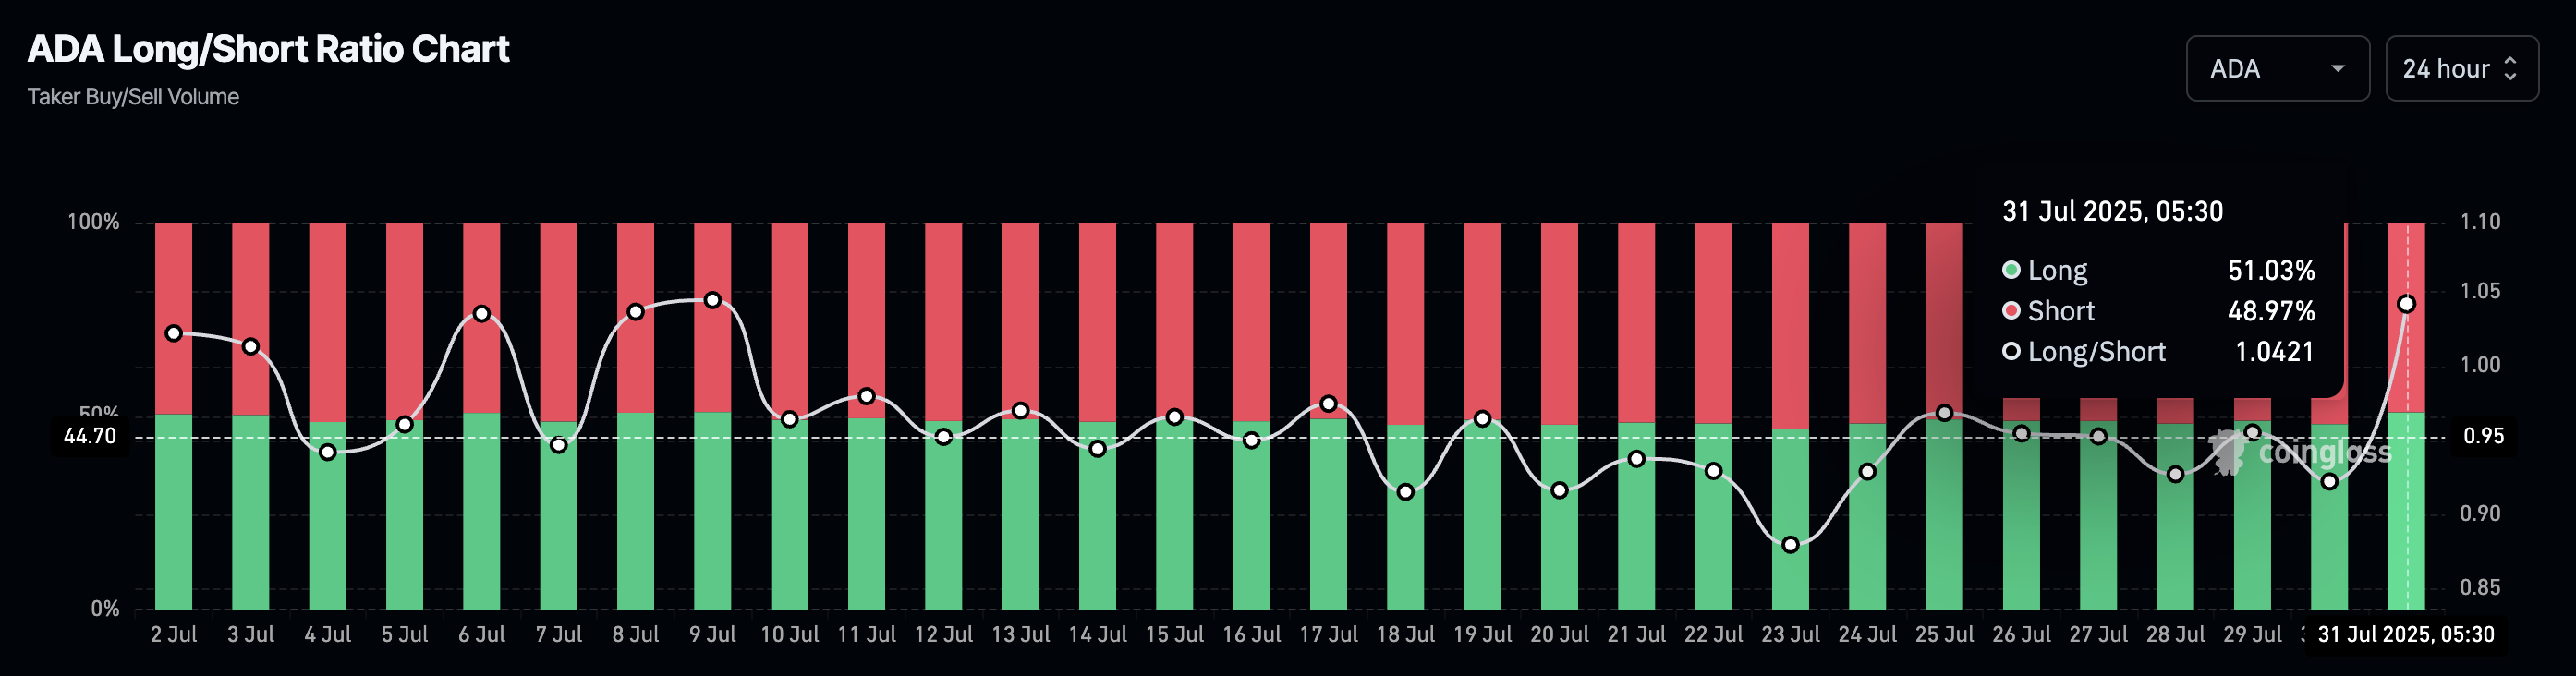
ADA long/short ratio. Source: Coinglass
The ADA exchange liquidation map indicates that $8.57 million in short positions have been built up at $0.797. This suggests that a price surge to this level would wipe out the bearish positions, tilting the ADA derivatives market bullish.
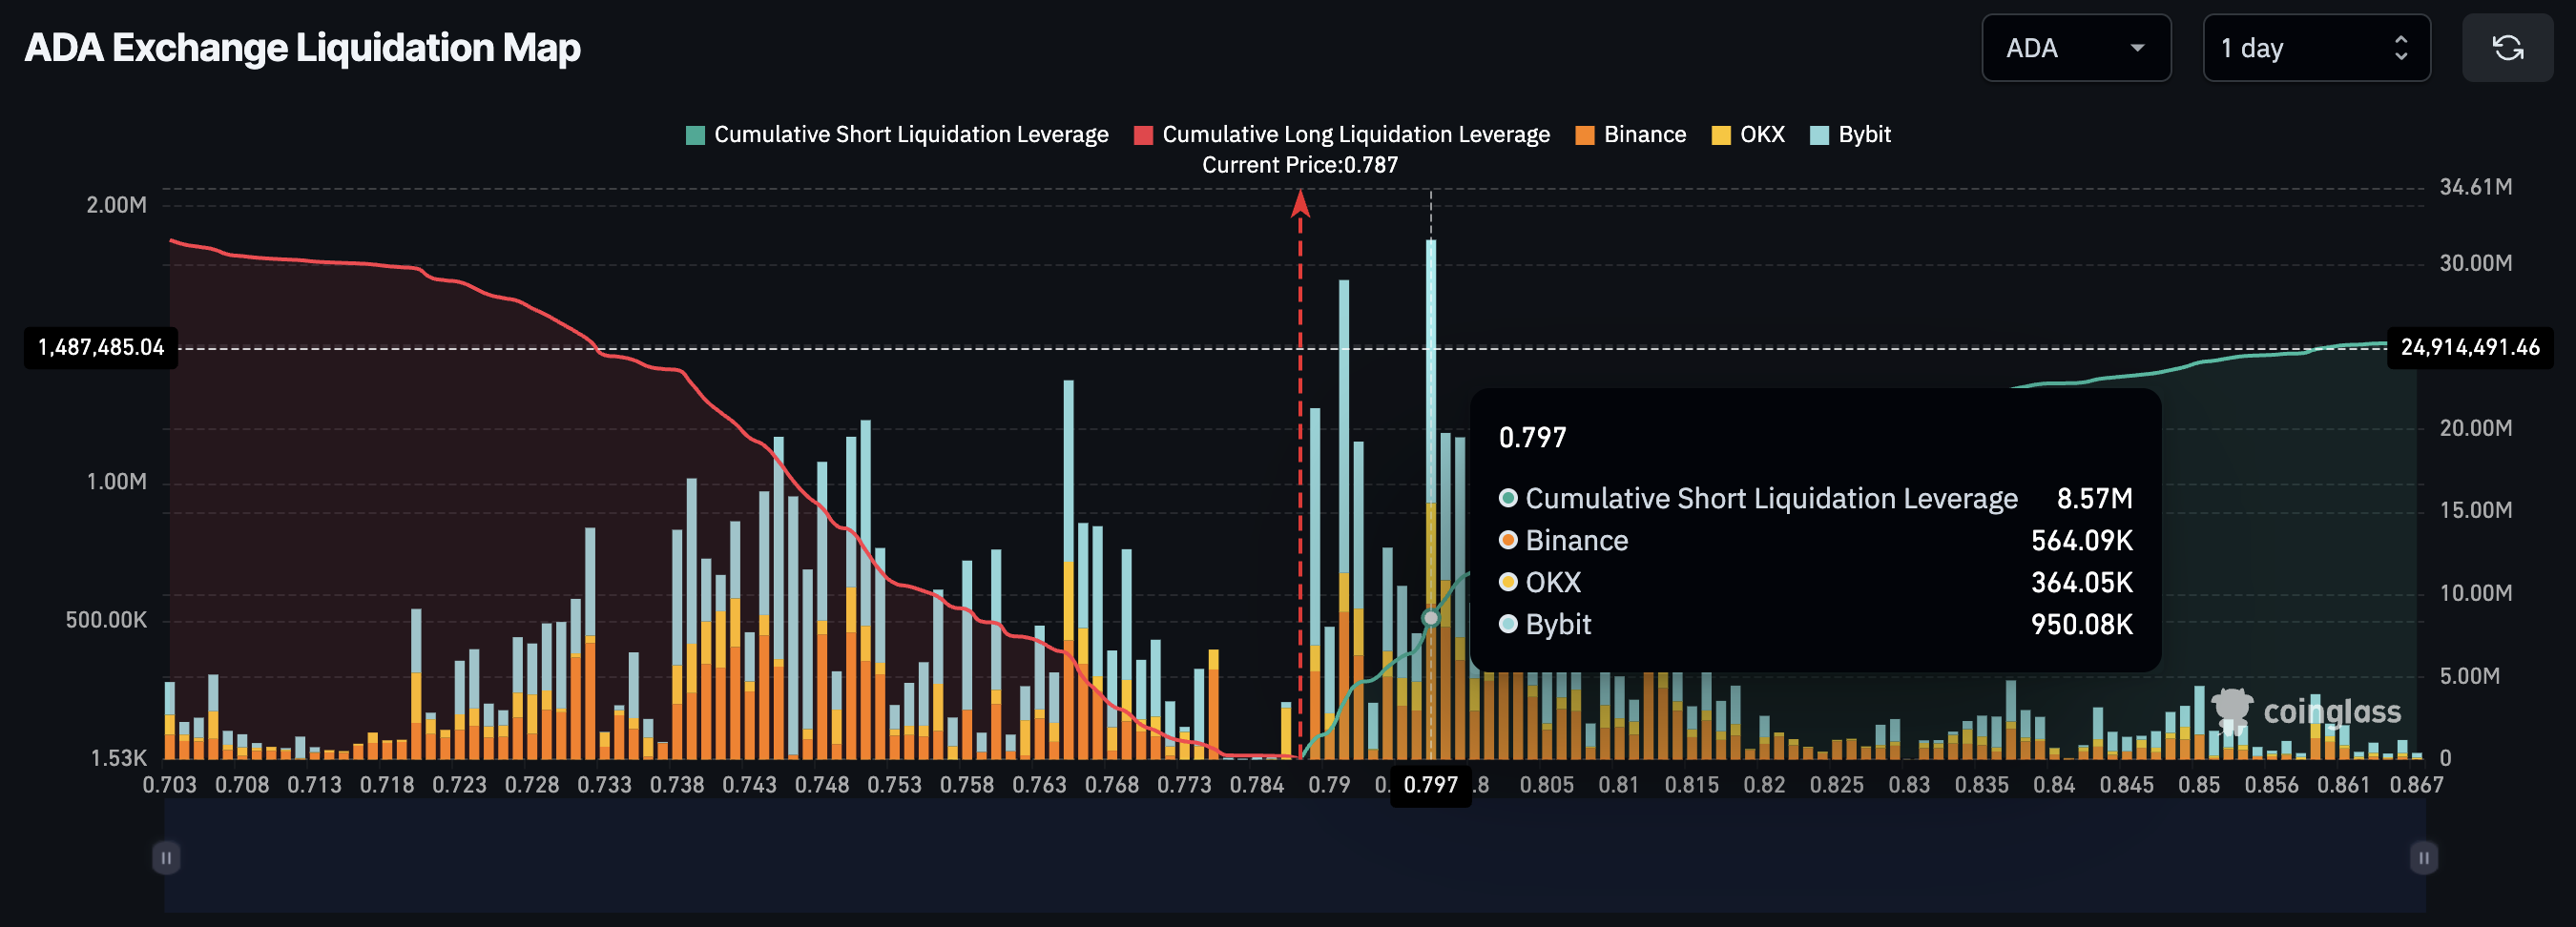
ADA exchange liquidation map. Source: Coinglass
Cardano recovery targets wedge breakout
Cardano prints its fourth consecutive bullish candle on the 4-hour time frame as it bounces off the S1 pivot level at $0.7498.
The recovery run has reached the 100-period Exponential Moving Average (EMA) at $0.7886, with bulls targeting the overhead trendline of a falling wedge pattern formed on the 4-chart (see below).
It is worth noting that the 50-period EMA at $0.8018 is moving closely with the overhead trendline. A potential close above the 50-period EMA would increase the wedge breakout chances, which could potentially extend the rally to the centre pivot level at $0.8435.
The Moving Average Convergence Divergence (MACD) line crosses above its signal line on the same chart, flashing a buy signal with the resurgence of green histogram bars. Still, the average line in the negative region highlights significant overhead pressure.
Further up, the Relative Strength Index (RSI) reads 47 as it heads higher towards the midpoint.
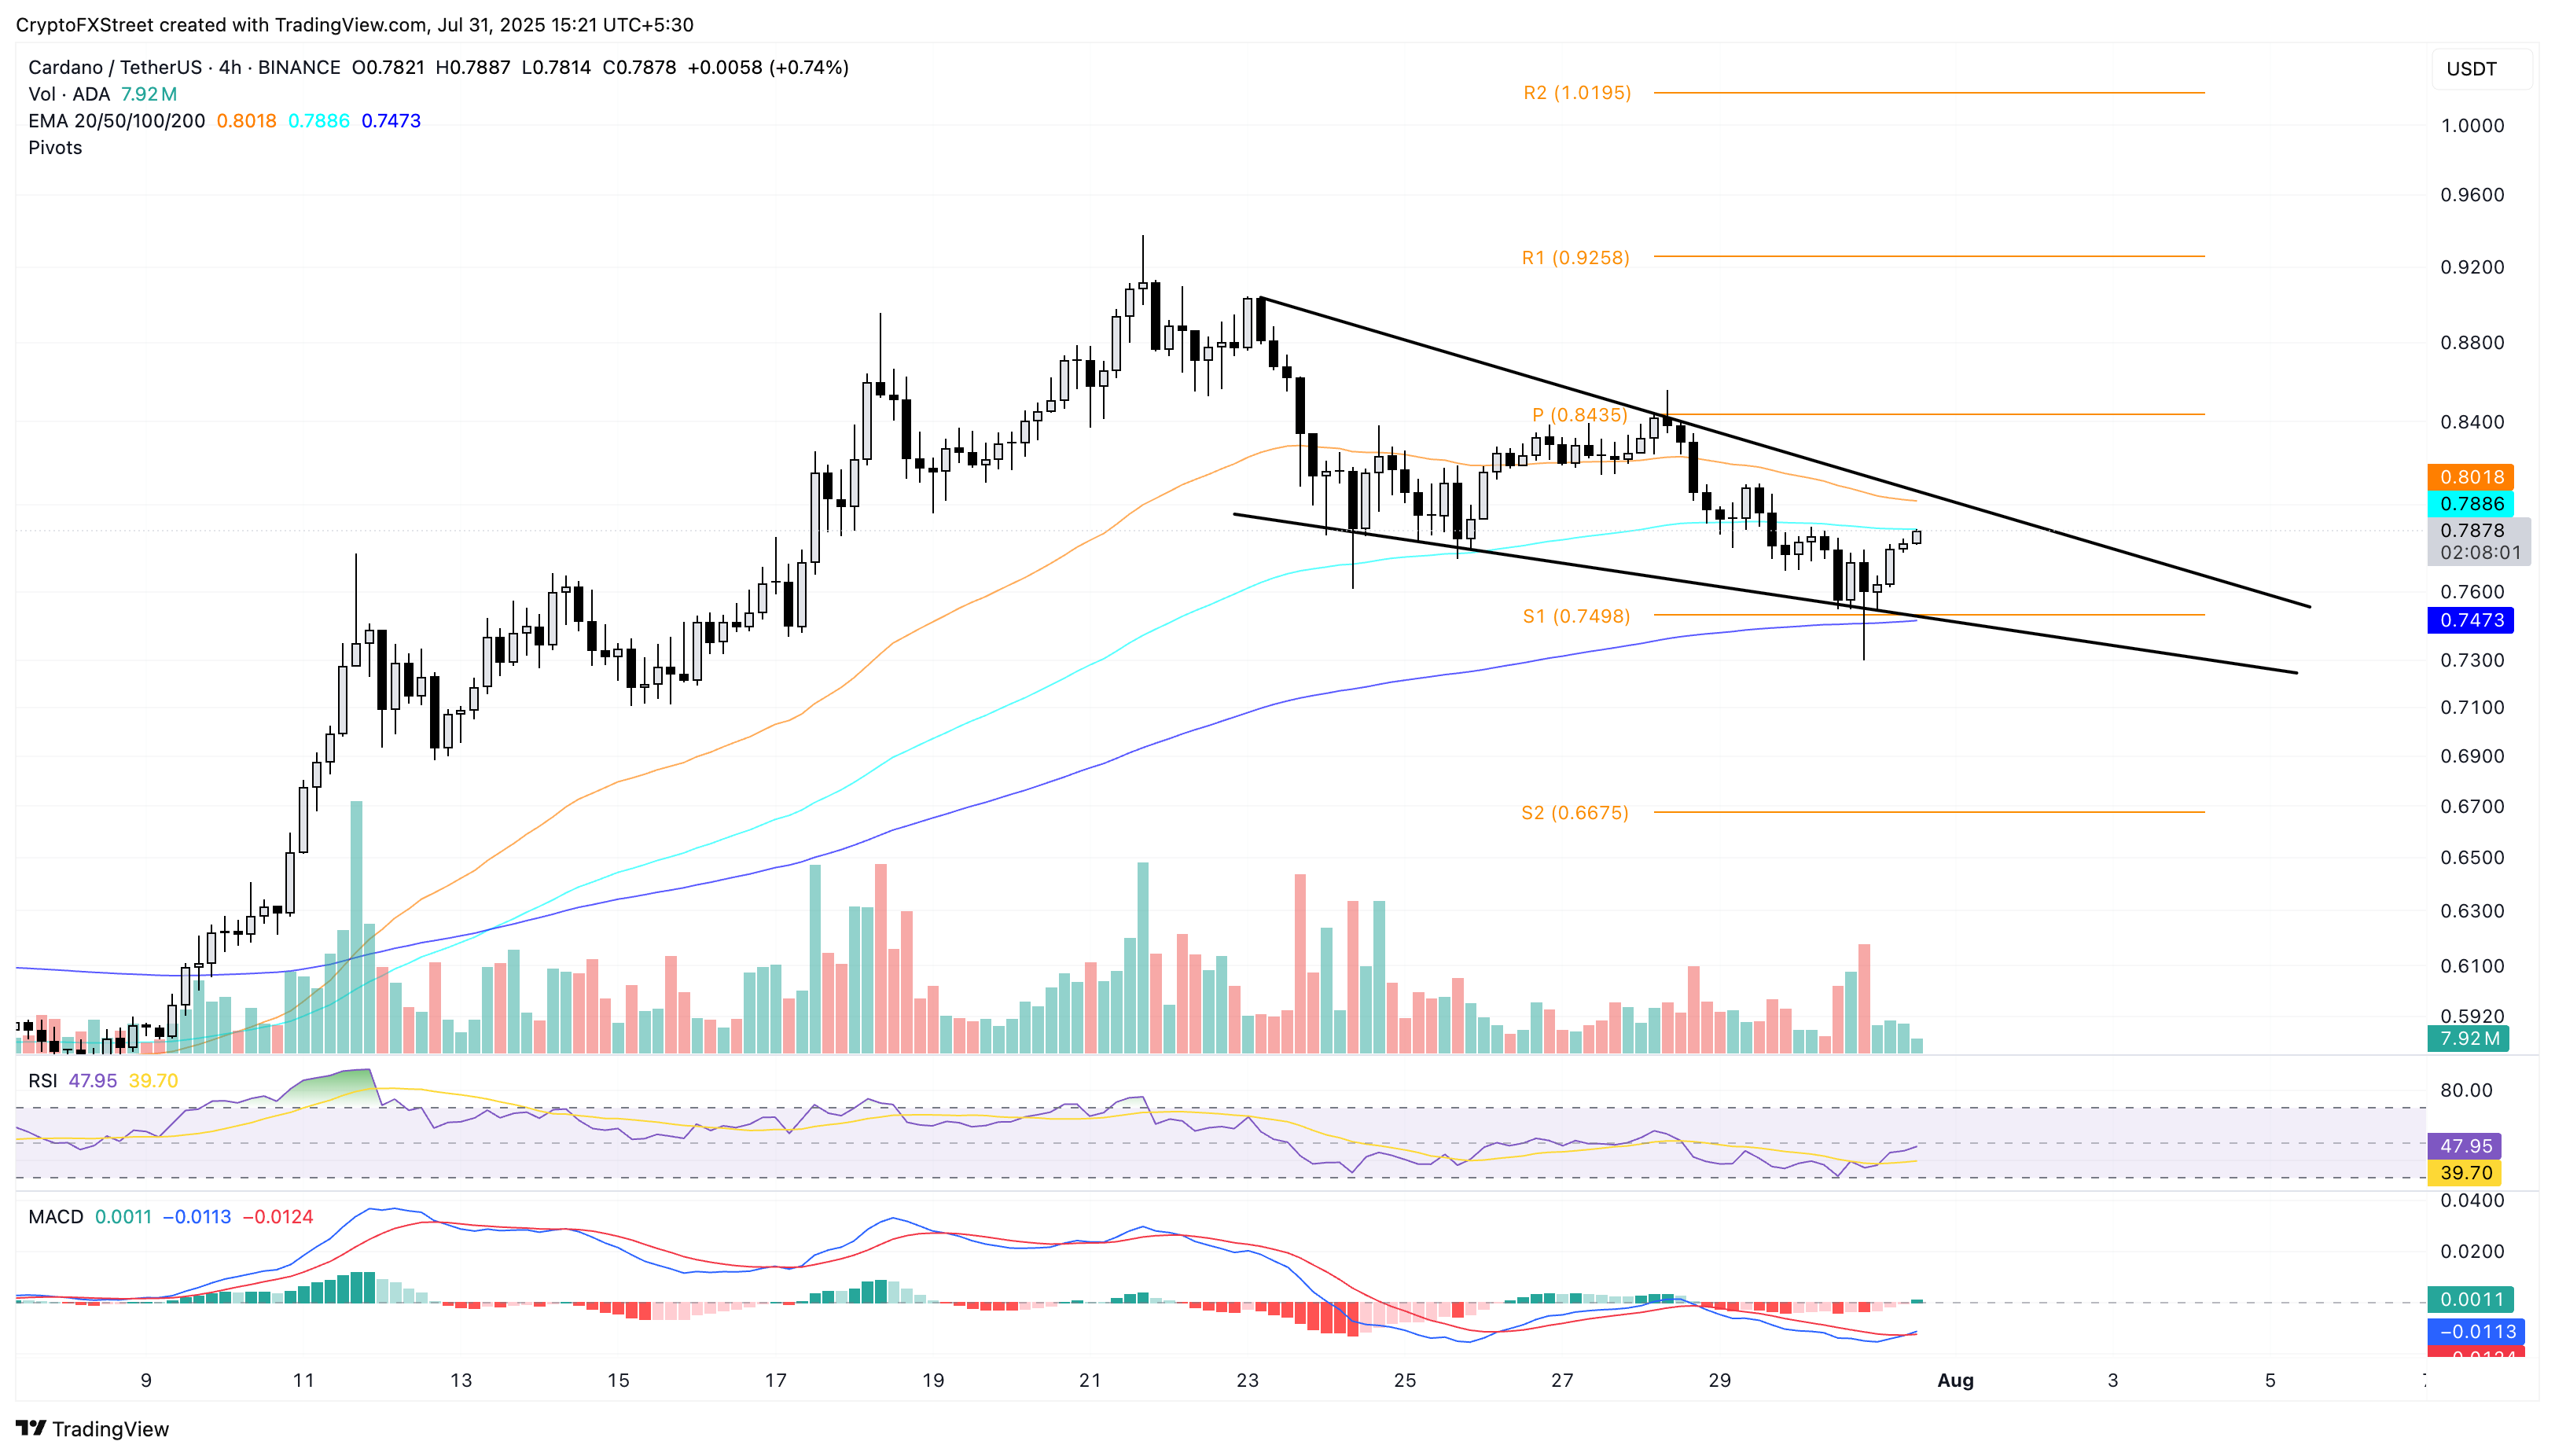
ADA/USDT daily price chart.
On the downside, a flip from the 100-period EMA could retest the S1 pivot level at $0.7498.
Author

Vishal Dixit
FXStreet
Vishal Dixit holds a B.Sc. in Chemistry from Wilson College but found his true calling in the world of crypto.



