Cardano Price Forecast: ADA dips with signs of further downside before potential rebound
- Cardano price continues to trade in the red on Tuesday after falling nearly 4% on the previous day.
- On-chain data suggest a further price dip, as NPL indicates ADA holders are realizing losses.
- The technical outlook suggests a dip toward $0.84, followed by a higher leg up.

Cardano (ADA) remains under pressure, extending its decline, trading around $0.91 at the time of writing on Tuesday after shedding nearly 4% in the previous session. On-chain data show that holders are realizing losses, as reflected in the negative NPL, hinting at mounting bearish sentiment. The technical outlook suggests ADA could dip further toward $0.84 before setting the stage for a potential rebound.
Cardano’s on-chain metric shows rising selling pressure
Santiment's Network Realized Profit/Loss (NPL) indicator computes a daily network-level Return On Investment (ROI) based on the coin's on-chain transaction volume. Strong spikes in a coin's NPL indicate that its holders are, on average, selling their bags at a significant profit. On the other hand, strong dips imply that the coin's holders are, on average, realizing losses, suggesting panic sell-offs and investor capitulation.
In the case of Cardano, the NPL indicator dipped from 23.13 million on Sunday to -26.56 million on Monday. This negative downtick indicates that the holders were, on average, realizing losses and suggests rising selling pressure. Historically, this development has triggered a capitulation event in ADA when a short price dip is followed by a surge in prices.
 [07-1755574005901-1755574005914.43.34, 19 Aug, 2025].png)
Cardano’s NPL chart. Source: Santiment
However, the short-term bearish outlook is further supported by the CryptoQuant data, as shown in the graph below. The Taker CVD (Cumulative Volume Delta) for ADA has been negative and increasing, indicating the Taker Sell Dominant Phase, highlighting selling pressure.
-1755574063447-1755574063449.png)
Cardano Spot Taker CVD chart. Source: CryptoQuant
Cardano Price Forecast: ADA could dip before a higher leg
Cardano price reached above its psychological level of $1 on August 14, rallying nearly 20% last week. At the start of this week, on Monday, it declined by 3.88%. At the time of writing on Tuesday, it continues to trade down at around $0.91.
If ADA continues to face a correction, it could extend the decline toward its key support at $0.84.
The Relative Strength Index (RSI) on the daily chart reads 61 after facing rejection from its overbought territory on Sunday, indicating fading bullish momentum. The Moving Average Convergence Divergence (MACD) also showed falling green histogram bars, further supporting the fading bullish momentum thesis.
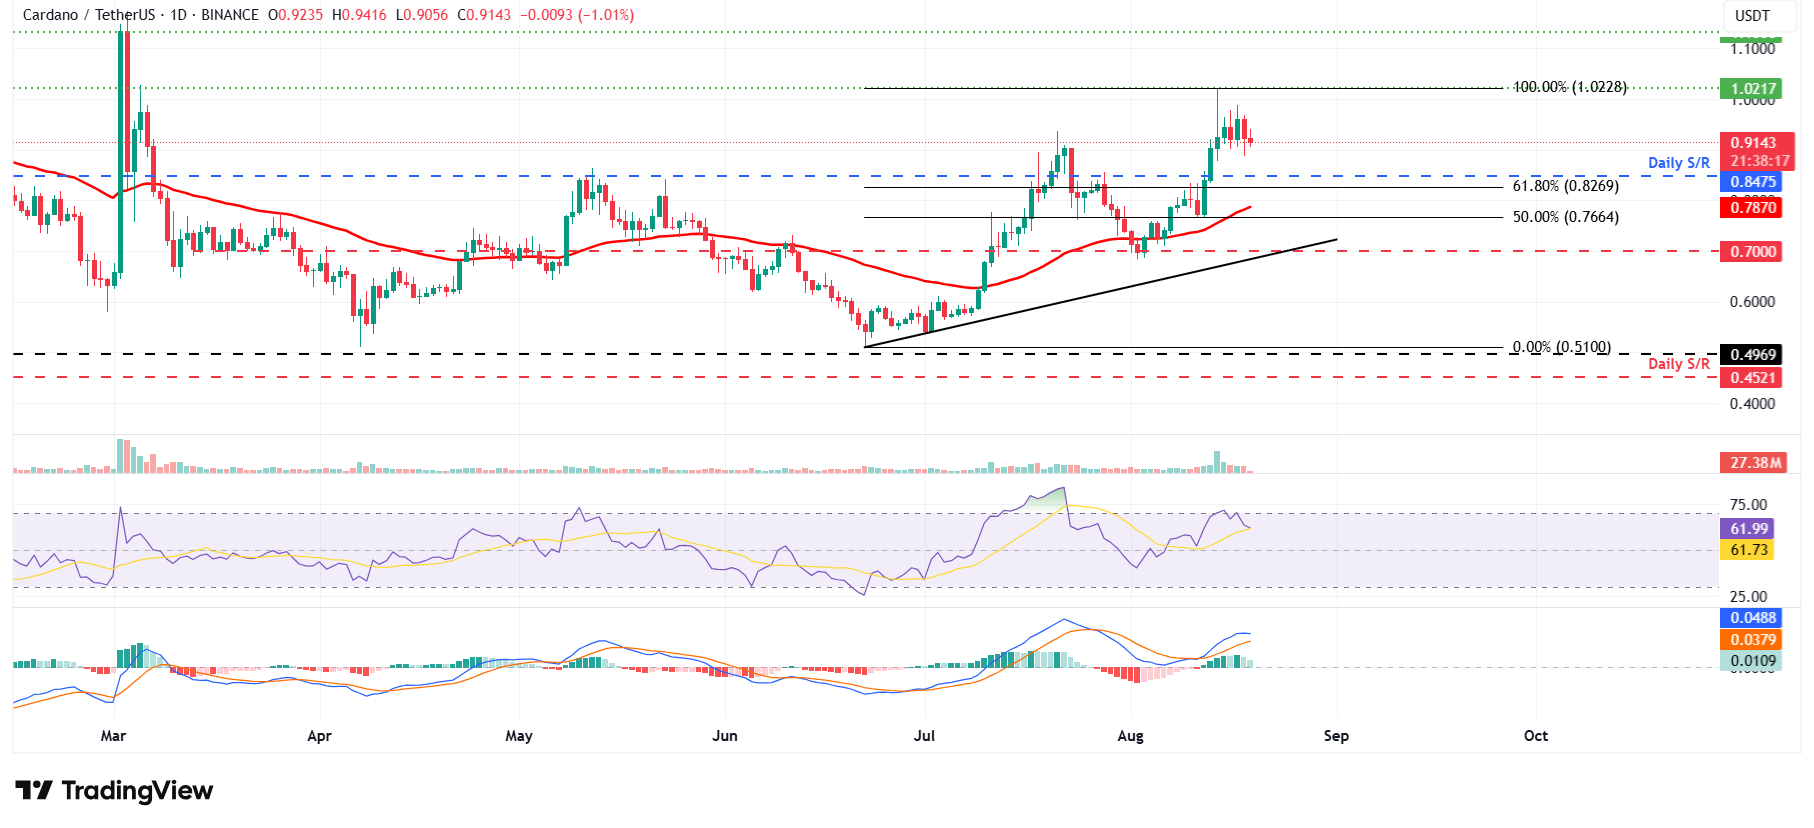
ADA/USDT daily chart
However, if ADA recovers, it could extend the rally toward its key psychological level of $1.
Author

Manish Chhetri
FXStreet
Manish Chhetri is a crypto specialist with over four years of experience in the cryptocurrency industry.



