Cardano price could trap impatient investors before triggering an explosive move to $0.505
- Cardano price hovers around $0.443 after falling to sustain above the $0.448 support level.
- ADA is at an inflection point, which could result in a 13% drop to $0.380 or a 13% rally to $0.505.
- Investors must pay close attention to the equal lows at $0.425 to determine which way ADA will head next.

Cardano price shows a consolidation below a stable support level and has yet to reveal a directional bias. The ongoing range tightening will likely resolve as the US markets head to a fresh start this week.
Cardano price awaits directional bias
Cardano price has been easy to trade by observing the liquidity fractal. This setup contains ADA sweeping the swing lows and recovering above the said level to kick-start a new run-up. So far, there have been seven liquidity runs, with the eighth on September 21.
The latest move knocked Cardano price below all of the swing lows after August 30 and formed equal lows at $0.425. Although initially, ADA moved above the $0.448 support level, it failed to sustain there and has resulted in a slow decline combined with a consolidation.
Going forward, investors can expect a sweep below the $0.425 level, followed by a quick recovery above this level. This development will represent the ninth liquidity run. Therefore, investors should look for a recovery above $0.425 after the sweep to identify the next move in Cardano price.
If successful, this development will trigger a run-up to $0.505, which would constitute a 17% ascent. However, if ADA kick-starts its run-up from the current position, it would represent a 13% move to $0.505.
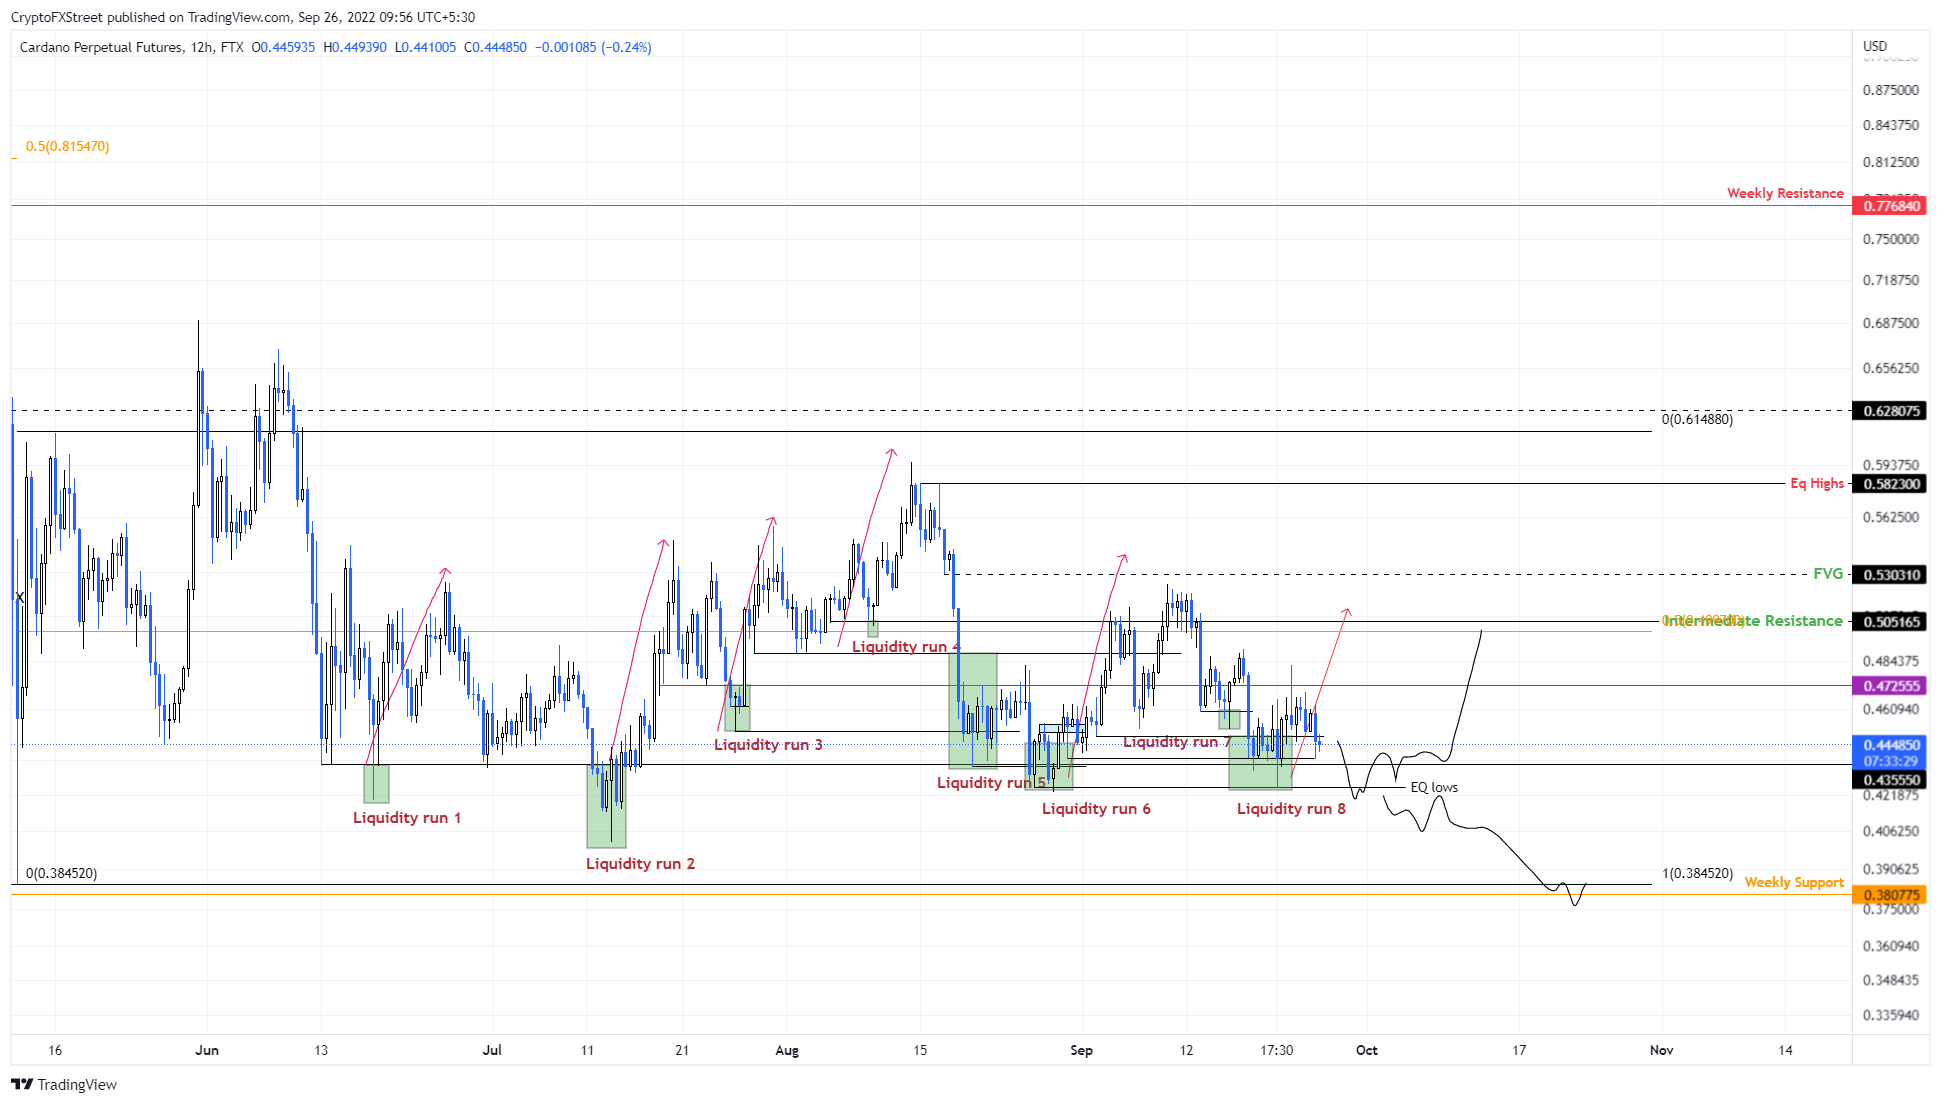
ADA/USDT 12-hour chart
While things are looking up for Cardano price, a breakdown of the equal lows at $0.425 without recovery will indicate that the sellers are in control. In such a case, ADA could slide lower and retest the range low at $0.384, which roughly coincides with the weekly support level at $0.380.
This downswing would constitute a 13% drop from the current position and is likely where the downside is capped for Cardano price.
Author

Akash Girimath
FXStreet
Akash Girimath is a Mechanical Engineer interested in the chaos of the financial markets. Trying to make sense of this convoluted yet fascinating space, he switched his engineering job to become a crypto reporter and analyst.



