Cardano Price Analysis: ADA looks to correct toward $1.1 after renewing record highs
- Cardano touched a fresh all-time high on Saturday.
- RSI indicator on the daily chart stays in the overbought territory.
- On-chain metrics show strong support aligns around $1.1.

Cardano climbed to a new all-time high of $1.4850 on Saturday but lost its bullish momentum. At the moment, ADA is trading around $1.25, losing around 5% on a daily basis.
Downward correction could extend to $1.1
On the daily chart, the ascending trend line coming from early February is currently forming support around $1.1 ahead of $1 (psychological level/20-day SMA). As long as the price manages to stay above those levels, the next leg down will be seen as a technical correction rather than a shift of trend.
However, a decisive break through that support area could trigger a deep selloff. On the upside, additional gains are likely if ADA makes a daily close above $1.5 (all-time high).
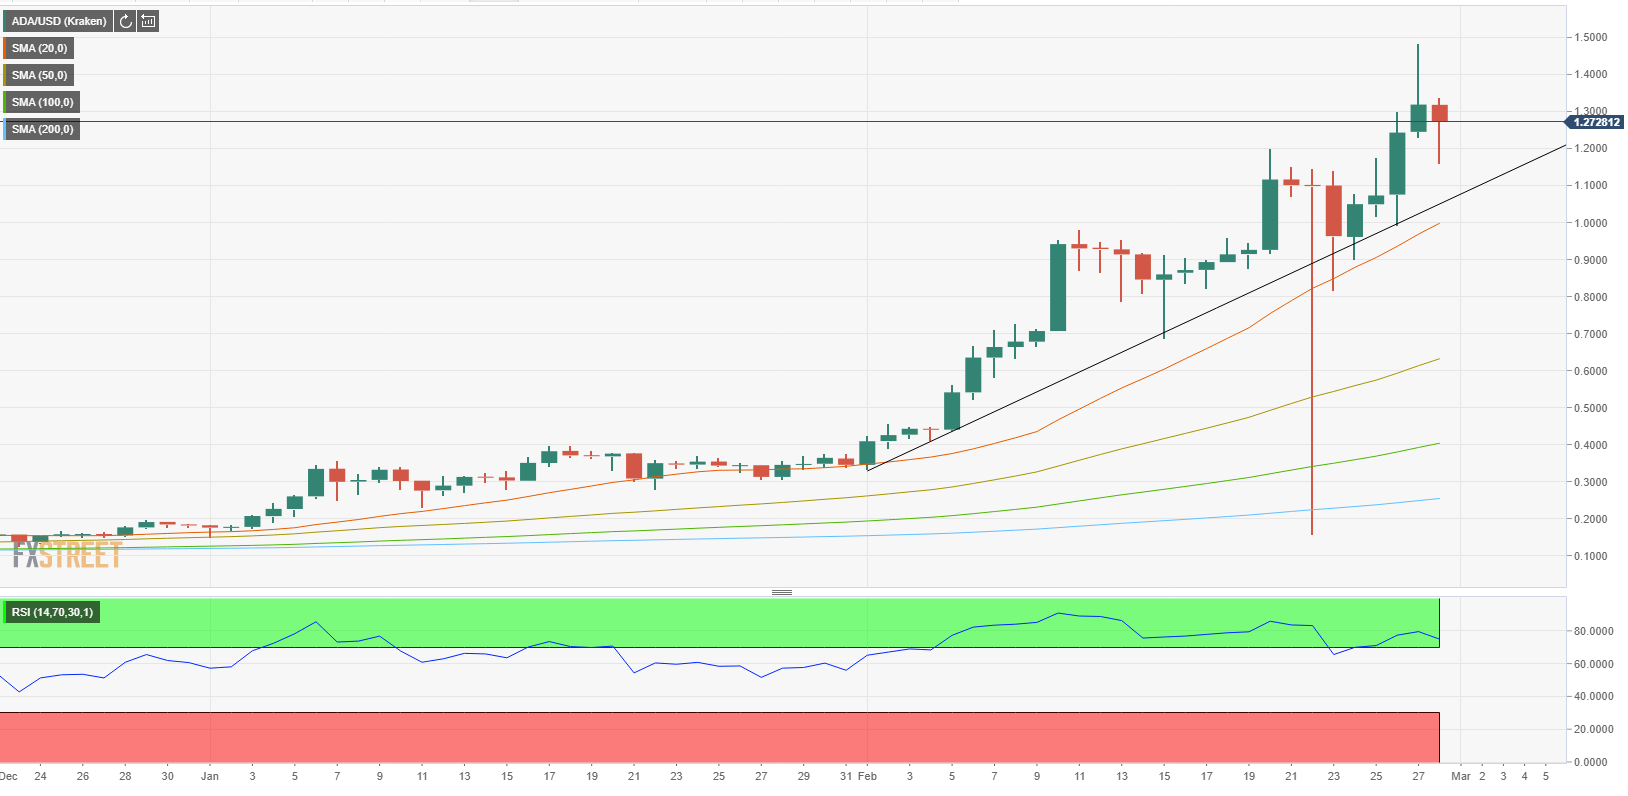
Cardano one-day chart
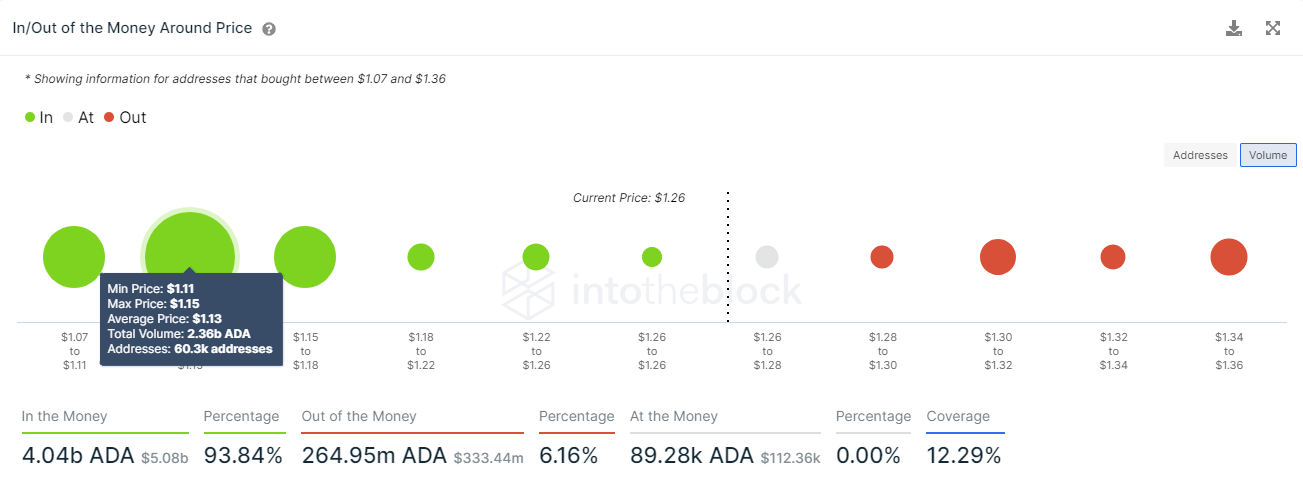
The lack of significant support areas ahead of $1.1 on IntoTheBlock's In/Out of the Money Around Price (IOMAP) model reinforces the view that ADA could edge lower toward that area in the near-term. However, the chart shows that 2.36 billion ADA at an average price of $1.13 had been acquired by 60,300 addresses, suggesting that ADA will have a difficult time dropping below that level.
Cardano retreated sharply after surging to a fresh record high on Saturday and eyes $1.1-$1 area as the next target. If buyers manage to keep ADA afloat above that region, the bullish momentum could start to gather strength.
Author

Eren Sengezer
FXStreet
As an economist at heart, Eren Sengezer specializes in the assessment of the short-term and long-term impacts of macroeconomic data, central bank policies and political developments on financial assets.


