Cardano and Binance Coin Price Forecast: Altcoins ADA and BNB show weakness in momentum indicators
- Cardano and Binance Coin prices edge slightly down on Wednesday after a mild recovery this week.
- The technical outlook for both altcoins suggests a correction ahead as their momentum indicators show weakness.
- On-chain data support the bearish thesis as the BNB funding rate is negative, and ADA’s dormant wallets are moving.

Cardano (ADA) and Binance Coin (BNB) prices edge slightly down, trading around $0.66 and $598, respectively, at the time of writing on Wednesday after a mild recovery so far this week. The technical outlook for both altcoins suggests a correction ahead as their momentum indicators show weakness. Additionally, on-chain data support the bearish thesis, as the BNB funding rate is negative, and ADA’s dormant wallets are moving.
Cardano Price Forecast: ADA bears aim for double-digit fall
Cardano’s price faced a rejection around its 200-day Exponential Moving Average (EMA) near $0.73 and declined nearly 7% last week. The 200-day EMA roughly coincides with the weekly resistance level at $0.74, making this a key resistance zone.
At the start of this week, ADA recovered slightly and topped near $0.69 on Tuesday. At the time of writing on Wednesday, it trades below the 61.8% Fibonacci retracement (drawn from its August 5 low of $0.27 to the December 4 high of $1.32) at $0.67.
If ADA continues its correction, it could extend the decline by nearly 13% from its current level to retest the February 28 low of $0.58.
The Relative Strength Index (RSI) on the daily chart reads 42 and points downward after being rejected from its neutral level of 50 last week, indicating increasing bearish momentum. Moreover, the Moving Average Convergence Divergence (MACD) also showed a bearish crossover on Saturday, giving a sell signal and suggesting a continuation of the downward momentum.
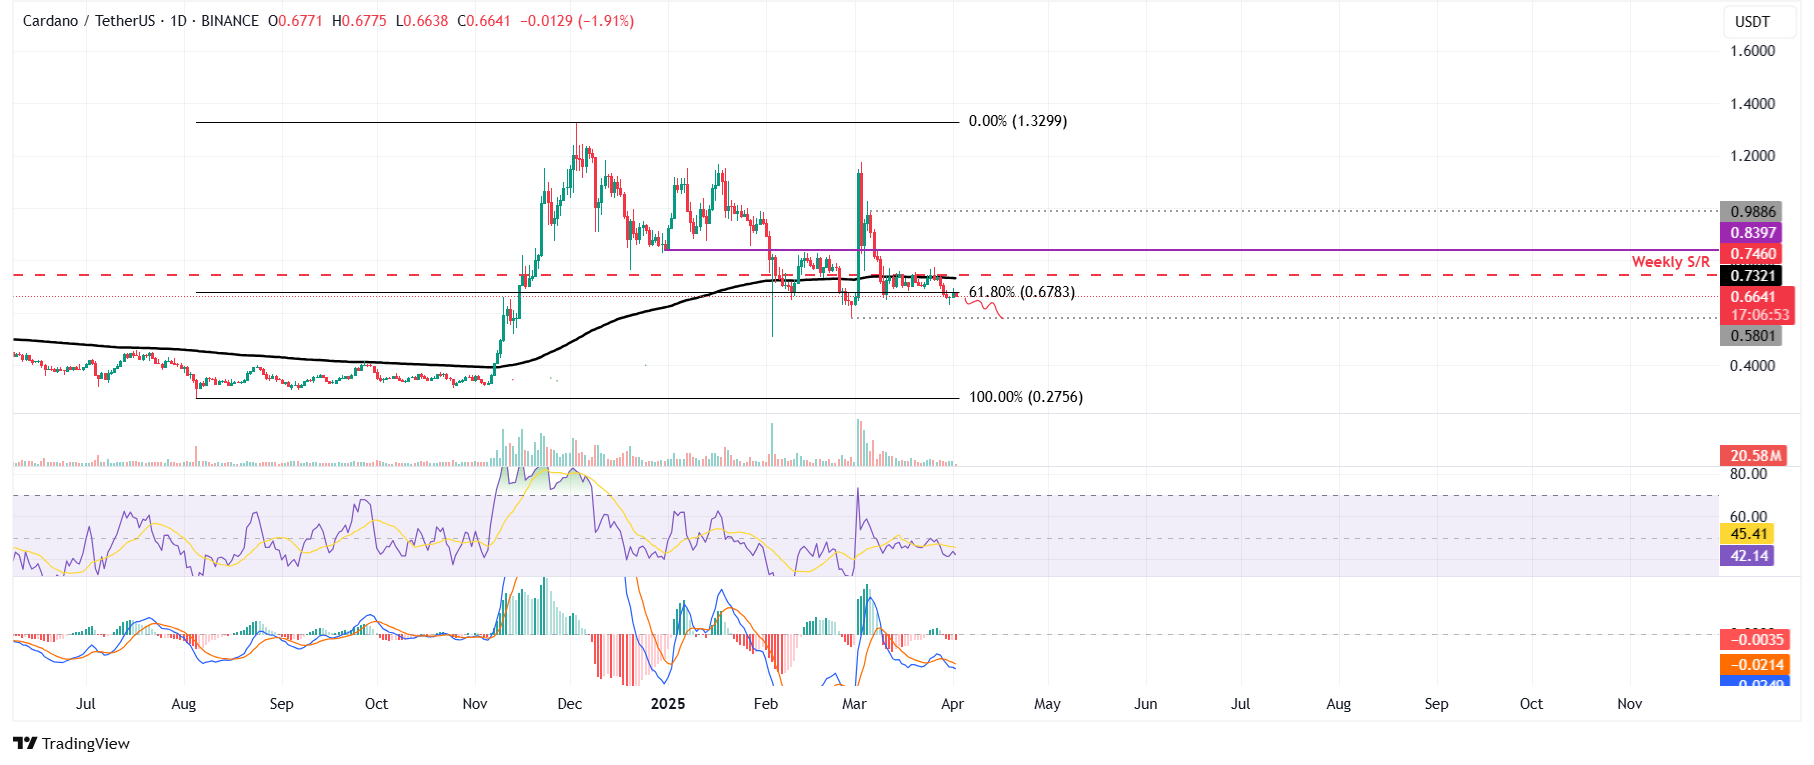
ADA/USDT daily chart
Santiment’s Age Consumed index aligns with the bearish outlook noted from a technical perspective. This on-chain metric can be used to spot short-term local tops or bottoms as the spikes in this index suggest dormant tokens (tokens stored in wallets for a long time) are in motion and can be moved to exchange wallets, increasing selling pressure on the token.
For ADA, history shows that the spikes were followed by a fall in Cardano prices. The most recent uptick on March 26 also forecasted that ADA was ready for a downtrend.
%20[11.19.30,%2002%20Apr,%202025]-638791792664871557.png)
ADA Age Consumed index chart. Source: Santiment
BNB Price Forecast: BNB bears aim for $550 mark
Binance Coin’s price broke below its 200-day EMA on Friday and closed below its daily support the next day. Earlier this week, BNB’s price recovered slightly but was rejected from its previously broken 200-day EMA and its daily level at $612.50. At the time of writing on Wednesday, it continues to trade down at around $598.40.
If BNB continues to face a pullback, it could extend the decline to retest its key support level of the 61.8% Fibonacci retracement (drawn from its August 5 low of $400 to the December 4 high of $793.82) at $550.44, which roughly coincides with the upward trendline (drawn by connecting multiple lows with a trendline since early August).
The RSI on the daily chart supports this bearish outlook, reading 45. It points downward after being rejected from its neutral level of 50 on Tuesday, indicating increasing bearish momentum. Moreover, the MACD also showed a bearish crossover on Sunday, giving a sell signal and suggesting a continuation of the downward momentum.
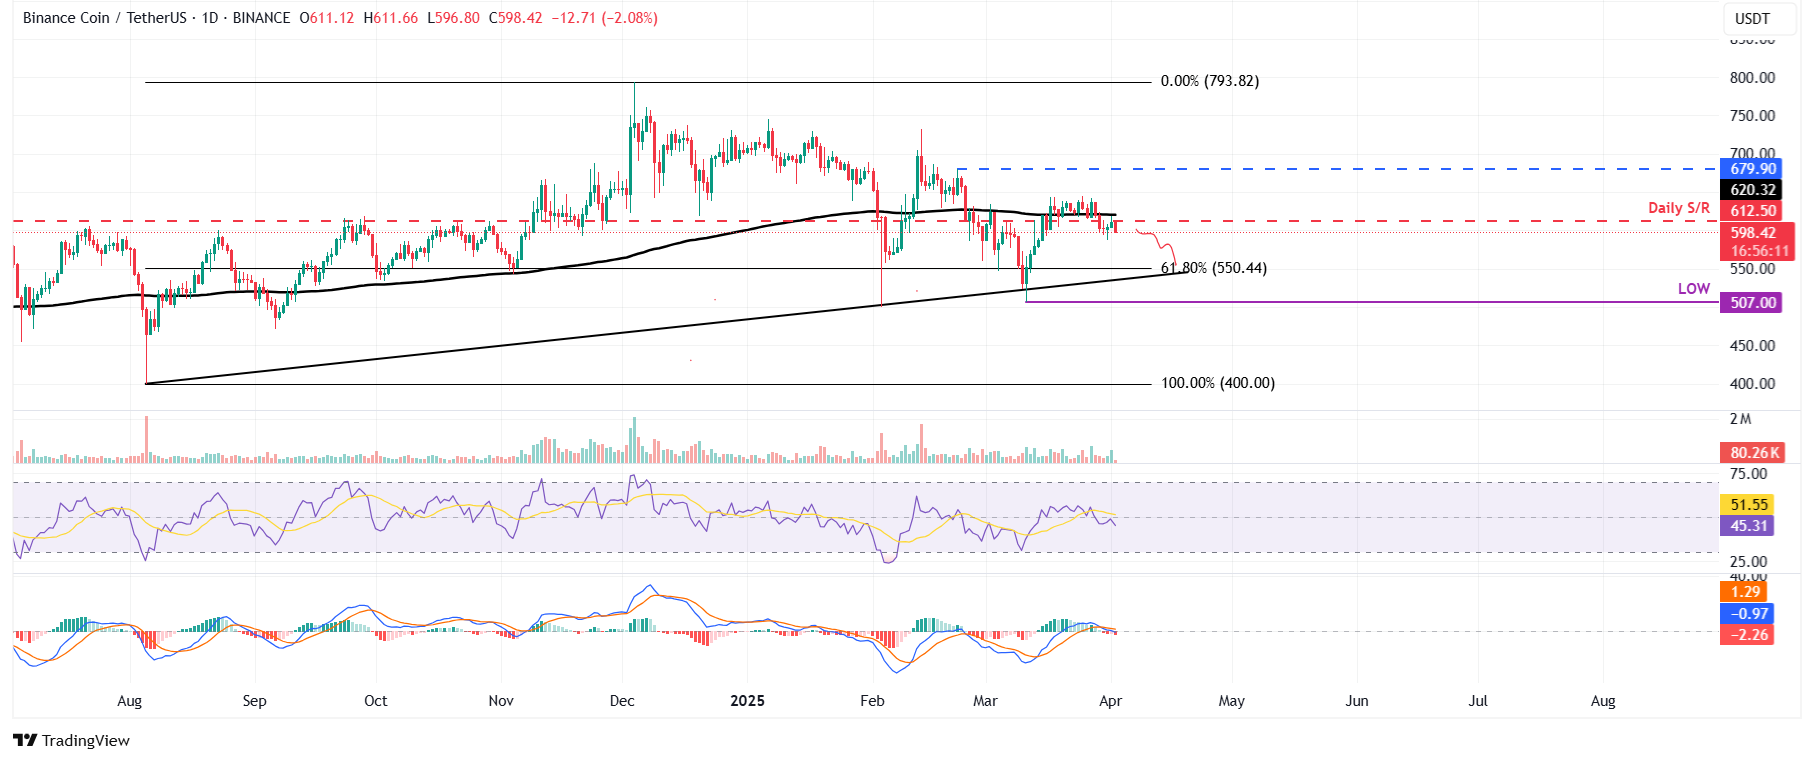
BNB/USDT daily chart
Additionally, according to Coinglass’s OI-Weighted Funding Rate data, the number of traders betting that the price of BNB will slide further is higher than those anticipating a price increase.
This index is based on the yields of futures contracts, which are weighted by their Open Interest (OI) rates. Generally, a positive rate (longs pay shorts) indicates bullish sentiment, while negative numbers (shorts pay longs) indicate bearishness.
In the case of BNB, this metric reached -0.07% on Monday, the lowest funding rate since mid-January. This rate is negative and indicates that shorts are paying longs. This scenario often signifies a bearish sentiment in the market, suggesting potential downward pressure on BNB’s price.
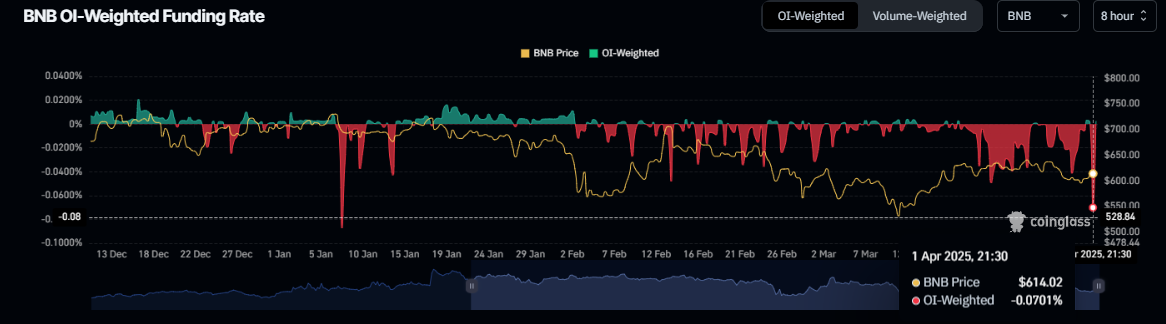
BNB funding rate chart. Source: Coinglass
Author

Manish Chhetri
FXStreet
Manish Chhetri is a crypto specialist with over four years of experience in the cryptocurrency industry.


