BTC/USD Technical Analysis: if the selling continues here are some levels you may need to watch
- Bitcoin sinks today amid no real fundamental drivers
- Support kicks in at 10,000.00 as buyers jump in
- There are some key levels to keep an eye on in the coming sessions

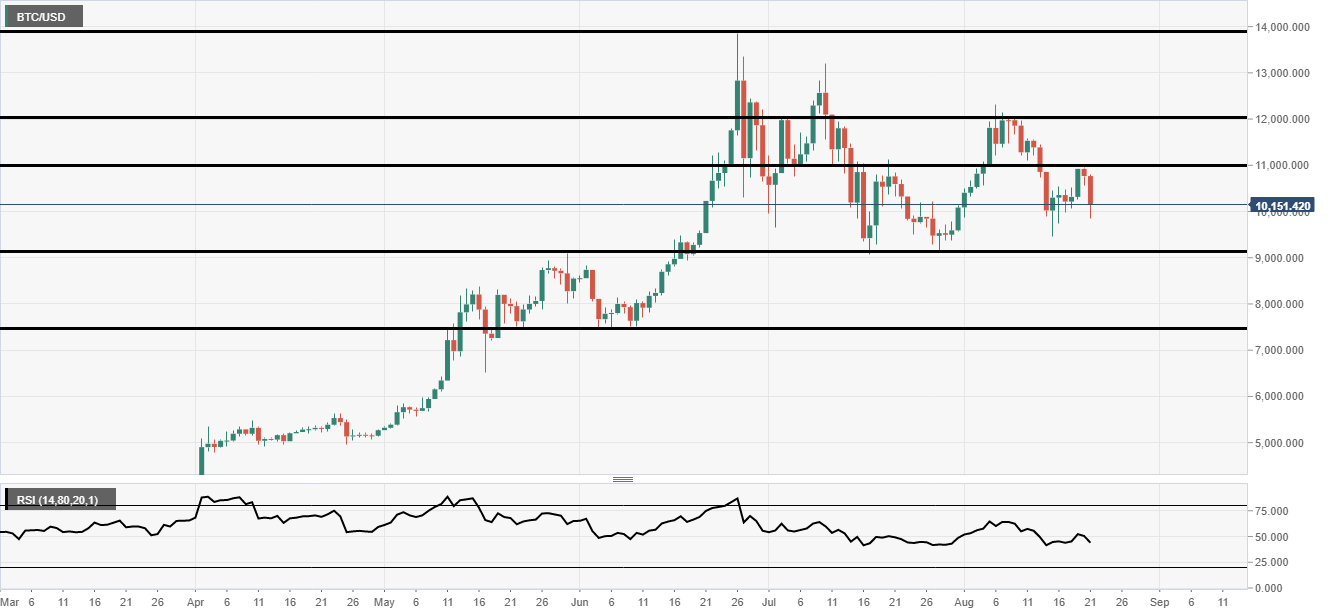
Bitcoin dramatically fell through 10,000.00 today after a heavy session of selling from the Asia close through to the beginning of the EU session.
Its seems now another lower high has been set in place on the daily chart above making it the 4th consecutive lower high without any wave high being challenged. Now if the trend is to turn down the 9467.57 low will be a major level as a break would make a lower high followed by a lower wave low.
However, below that, there is a more important level when it comes to chart structure and that is the 9049.54 wave low from 17th July. This level is the main consolidation low after the most recent rally to 13,880.00.
On the hourly chart below, in the short term, BTC/USD prices look set to recover. The term "sell on rallies" now comes to mind as today's sell of was so powerful. Since the trendline in red broke the down move has been relentless. All the hourly levels are marked in red with all the major level on the daily chart above still in black. 10,200.00 has acted as a support and resistance level so that should be somewhat significant, but the more important level is above that just under 10,500.00. Other than that, it seems unlikely but if we move even higher the retest of the red trendline could be a possibility.
-637020152049173568.png)
Author

Rajan Dhall, MSTA
FX Daily
Rajan Dhall is an experienced market analyst, who has been trading professionally since 2007 managing various funds producing exceptional returns.


