BTC/USD: Forecasting Elliott Wave ((iv)) correction in Bitcoin

in this article we will have a look on BTC/USD. You will see how we were able to forecast in advance the upcoming wave ((iv)) correction. Bitcoin is trading within a larger degree cycle that started from 11.21.2022. Current cycle appears to be within extended wave 3. Inside our members area we cover also 4 hour, Daily & Weekly charts. That will give you also a bigger context as where we stand in the cycle. Moreover, as day trading or position trading can be applied when trading our charts it is important for a trader to know and understand when the market is approaching a reaction point within a cycle. This can help with making better decisions as whether is good to take profits, move stop loss, enter trades etc.
Firstly, let’s have a look on BTC/USD from 01.24.2023
BTC/USD 2H chart 01.24.2023
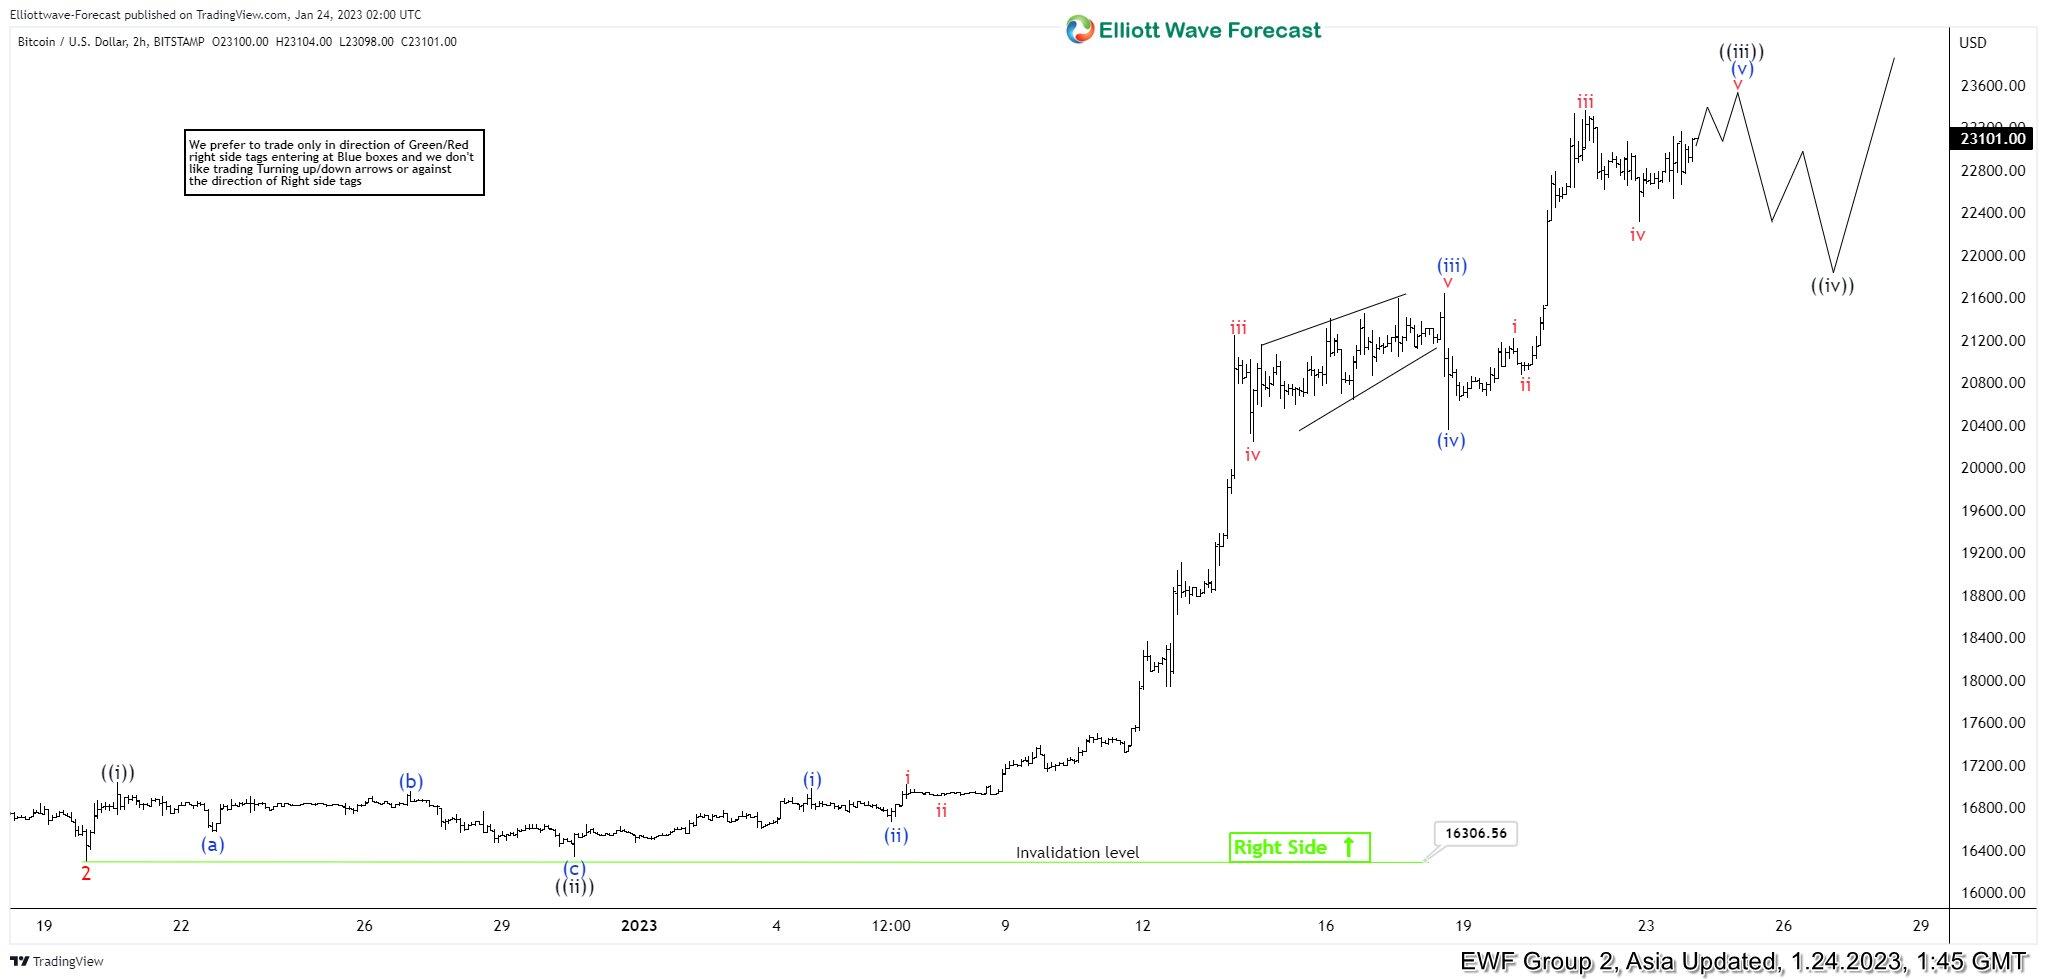
Bitcoin has been trading higher in a wave ((iii)). However, It had created a nest and was trading higher within v of (v) of ((iii)). At that point the market was getting closer to the end of wave ((iii)) and soon was expected to pullback in ((iv)). Fast forward, a couple of days later here is what happened.
BTC/USD 2H chart 02.06.2023
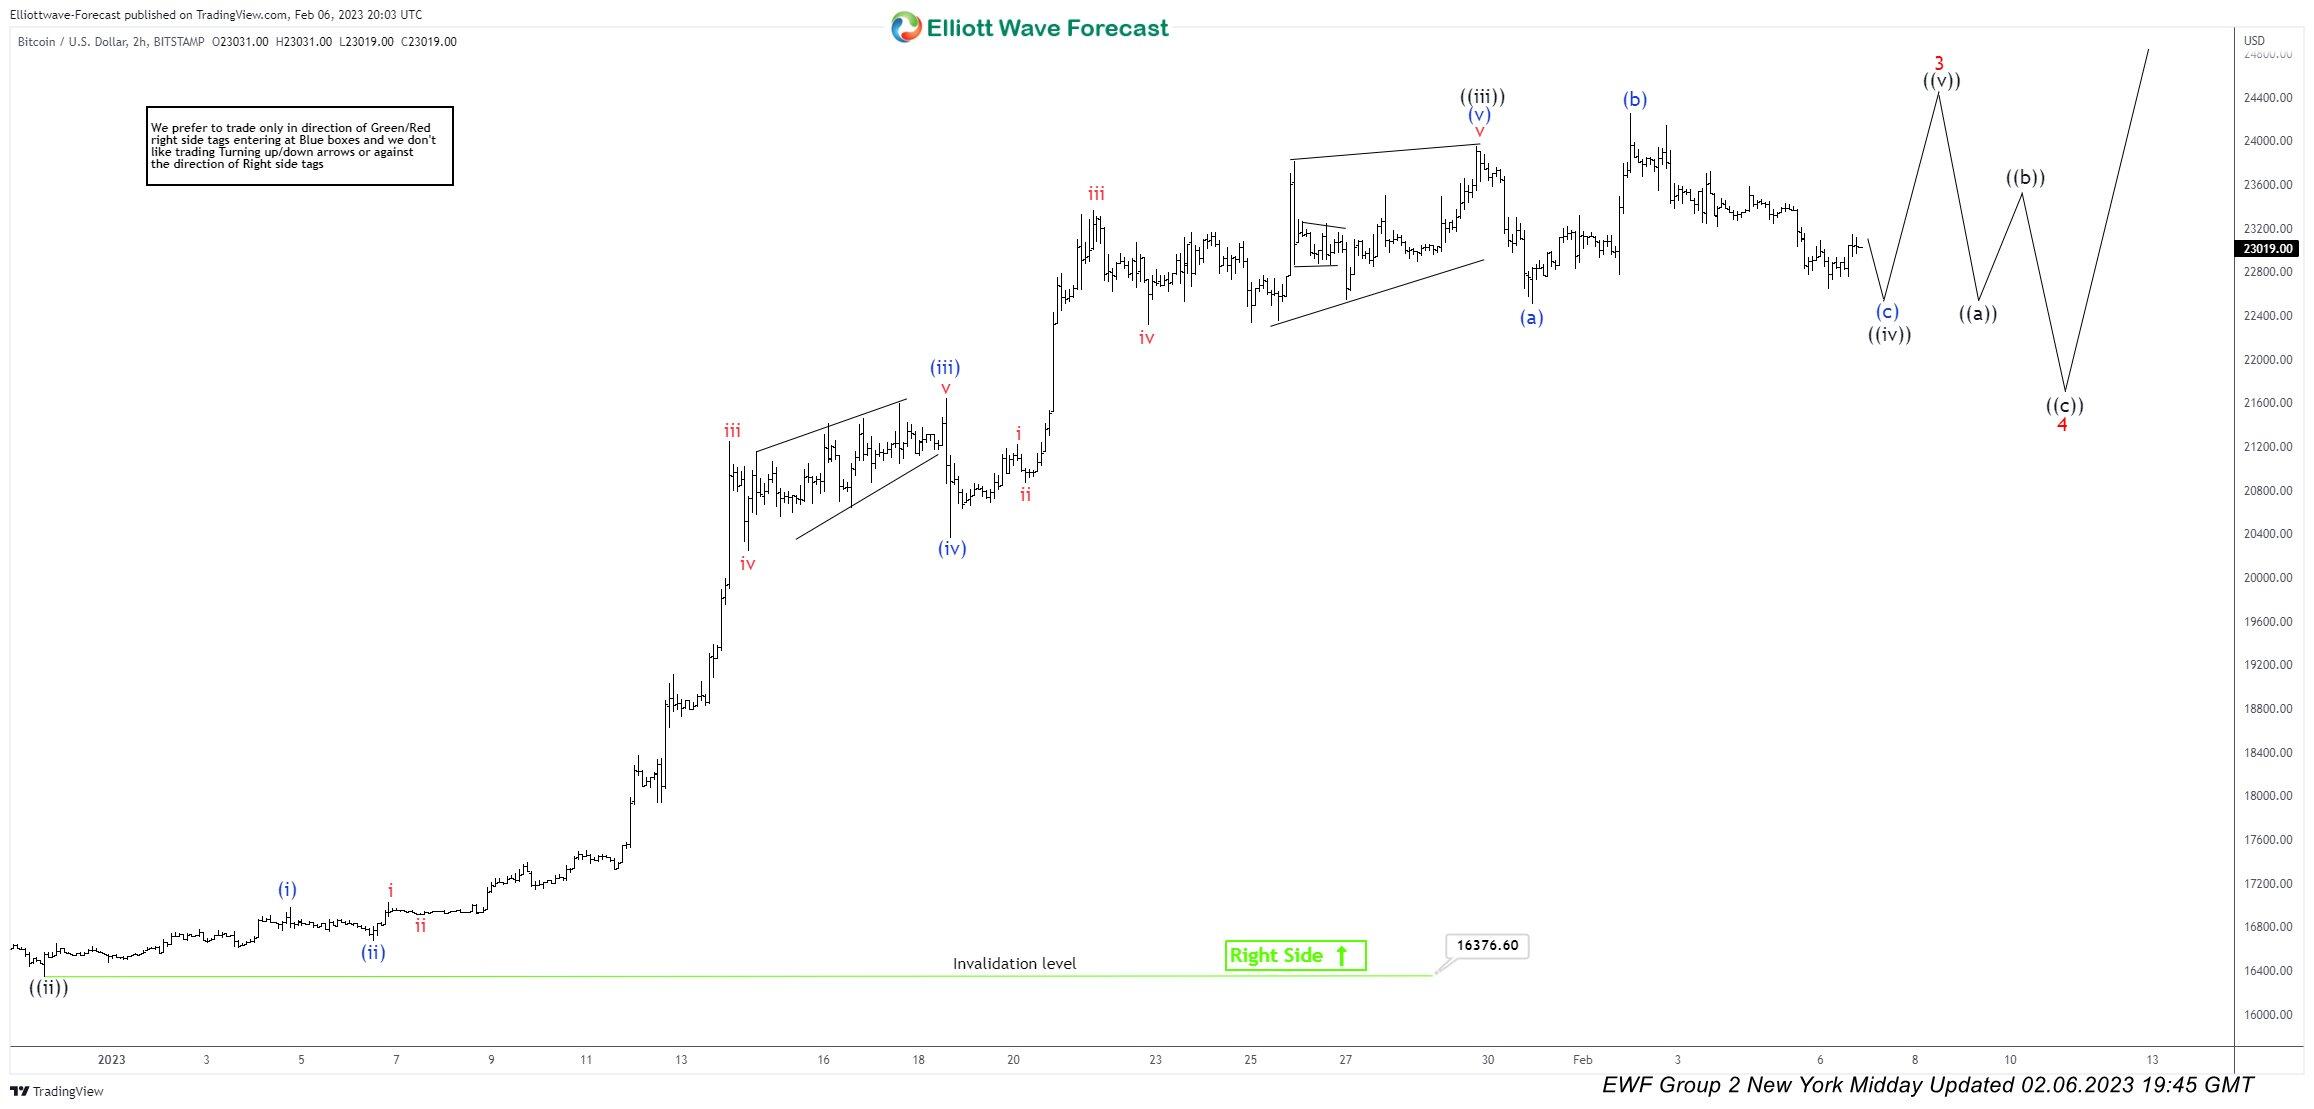
Bitcoin has ended as expected wave ((iii)) and pullback in ((iv)) played out as a flat correction within wave ((iv)). Soon it expected to make the next and final move higher in ((v)) to end wave 3 in red. By having the information and expected path beforehand in mind traders can make better decisions with their trades. This is one of the many advantages and benefits members get at Elliott Wave Forecast. Apart from the charts you can see Daily technical videos, Live Analysis sessions in which you can ask questions in real time. Live trading room is also available in which we discuss trading ideas using our system. Learn to trade the right side and anticipate the next move in the market today.
Author

Elliott Wave Forecast Team
ElliottWave-Forecast.com



