|

BTC/USD Elliott Wave: Forecasting the rally from intraday equal legs area

In this technical article we’re going to take a quick look at the Elliott Wave charts of Bitcoin BTCUSD. As our members know, BTCUSD is showing impulsive bullish structure in the cycle 15431 low. We have been calling for the rally in the cryptocurrency after 3 waves pull back. Our team recommended members to avoid selling Bitcoin, while keep favoring the long side. In the further text we are going to explain the Elliott Wave Forecast.

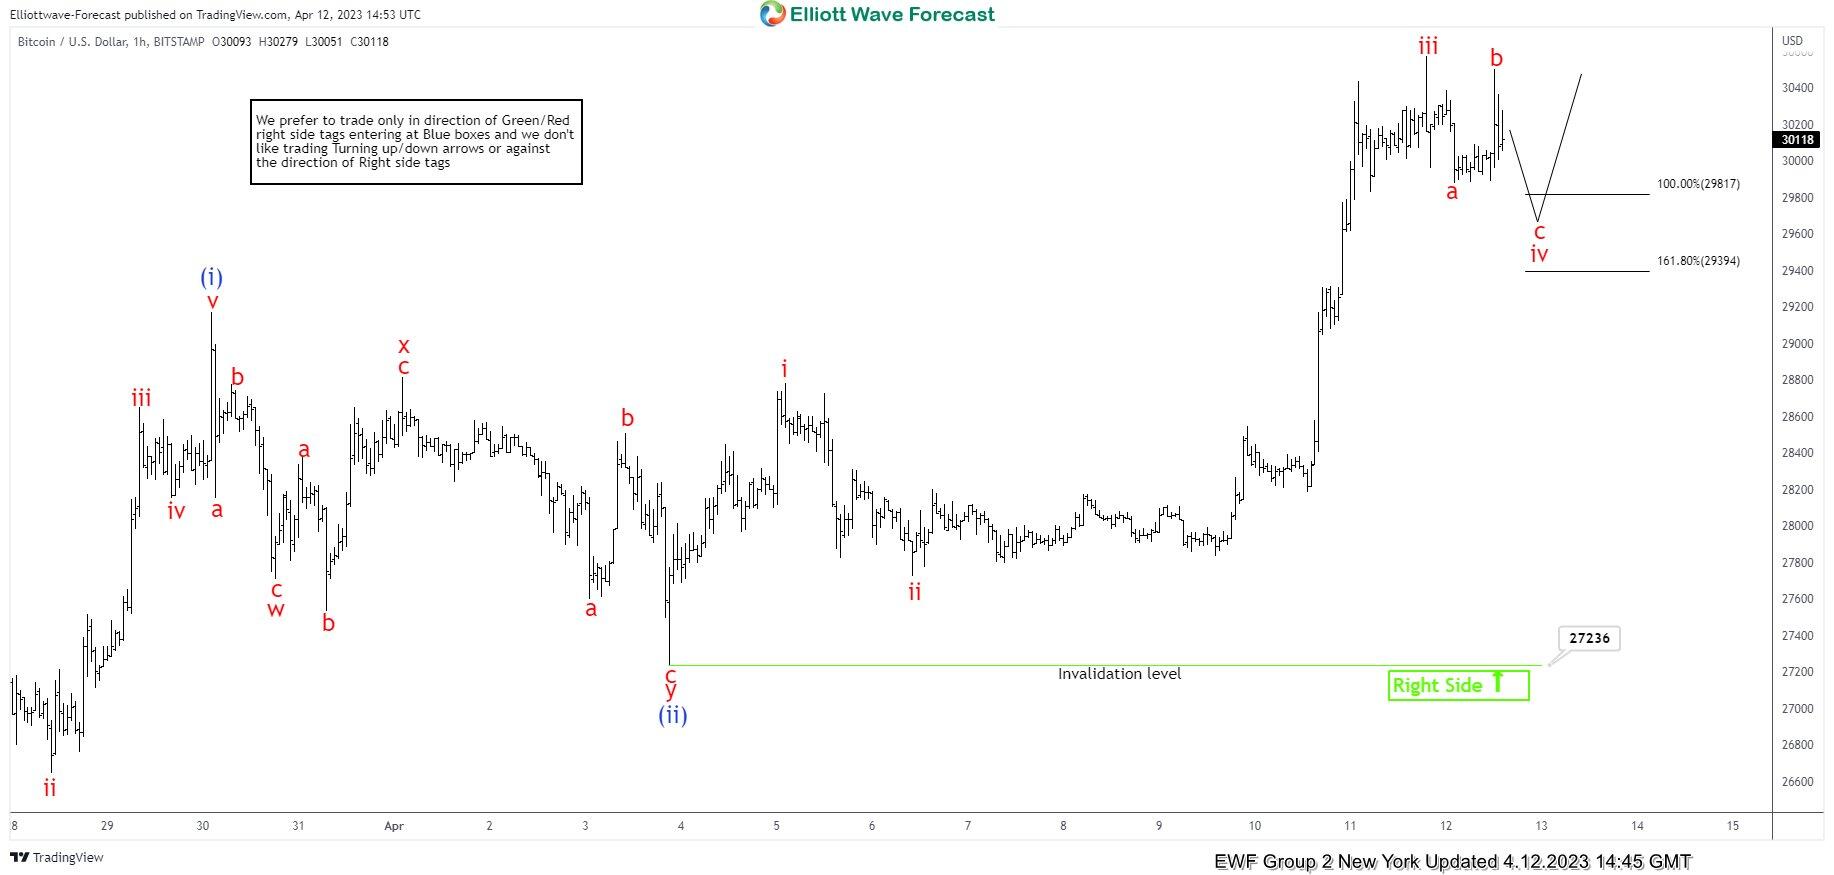
Bitcoin (BTC/USD) Elliott Wave 1-hour chart 4.12.2023

Cycle from the 27236 low looks impulsive, however as of right now we see only 3 waves up. We assume wave iv red pull back is still in progress. Once correction completes BTCUSD should ideally see another leg up to complete the proposed short term cycle as 5 waves.  At the moment structure of the pull back looks incomplete. We are calling for another leg down toward 29817-29394 ( buyers area). We don’t recommend selling it and prefer the long side. The crypto is expected to find buyers in 3,7,11 swings. We expect to see at least 3 waves bounce from that zone or further rally toward new highs ideally.

BTCUSD

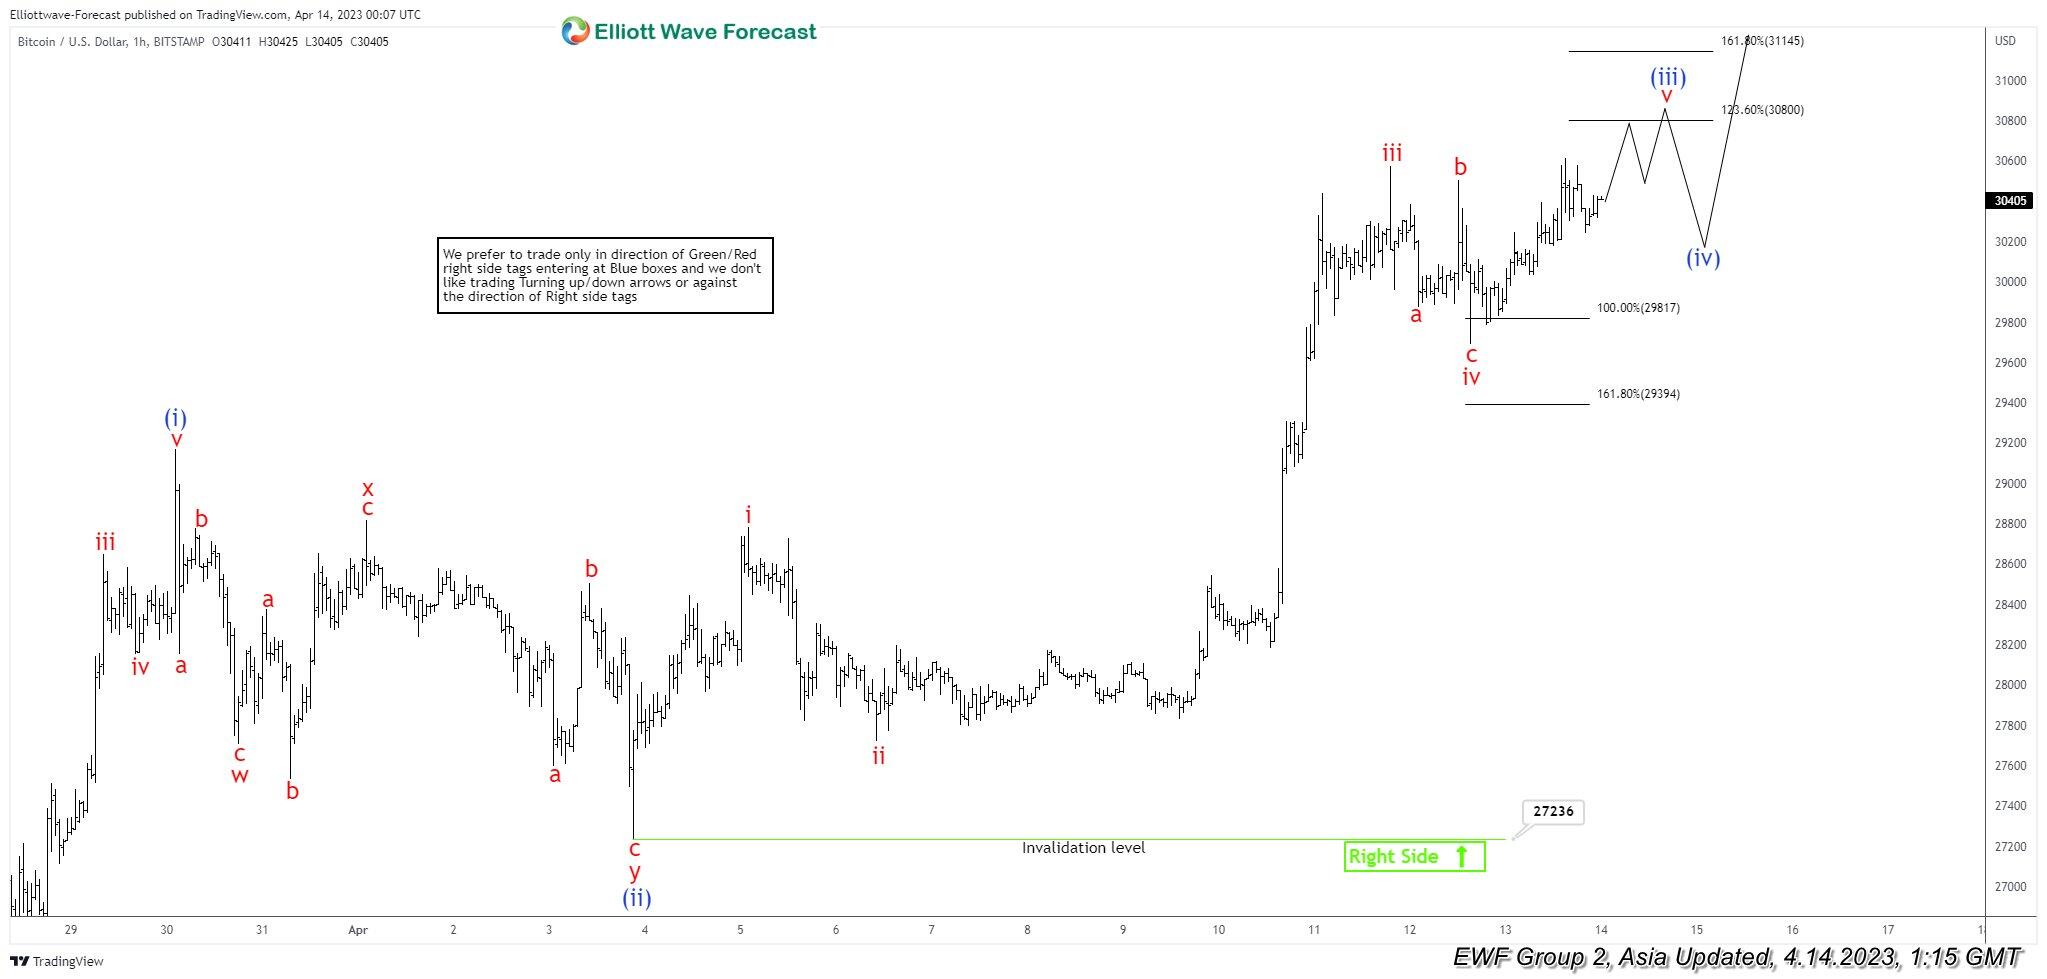
Bitcoin (BTC/USD) Elliott Wave 1-hour chart 4.14.2023

BTCUSD made the decline toward marked equal legs area: 29817-29394.  Bitcoin found buyers and we are getting good reaction from there. It broke previous peak already, confirming v red of (iii) blue is in progress toward 30800-31145 area.

BTCUSD

Author

Elliott Wave Forecast Team

Elliott Wave Forecast Team

ElliottWave-Forecast.com

More from Elliott Wave Forecast Team
Share:

Editor's Picks

Dogecoin, Shiba Inu, and Pepe extend losses on bearish signals

Meme coins are facing renewed selling pressure amid fading broad risk-on sentiment so far this week, with Dogecoin, Shiba Inu, and Pepe extending their losses after recent corrections.

PI recovers from slump as investors buy the dip

Pi Network rebounds by 2% at press time on Tuesday, regaining strength after a three-day decline. A renewed interest among investors, evidenced by outflows from Centralized Exchanges, backs the short-term recovery.

Hedera extends losses as bearish sentiment dominates

Hedera price extends its losses after falling nearly 4% the previous day. Weakening on-chain and derivatives data support a bearish outlook alongside an unfavourable technical outlook, suggesting a deeper correction for HBAR.

Top Crypto Losers: BCH, HYPE, PUMP extend losses as Bitcoin drops below $64,000

Altcoins, including Bitcoin Cash, Hyperliquid, and Pump.fun, are leading losses over the last 24 hours as Bitcoin falls below $64,000 on Tuesday. The technical outlook for BCH, HYPE, and PUMP flags downside risk amid broader market selling.

Bitcoin Price Annual Forecast: BTC holds long-term bullish structure heading into 2026

Bitcoin (BTC) is wrapping up 2025 as one of its most eventful years, defined by unprecedented institutional participation, major regulatory developments, and extreme price volatility.

Bitcoin: No recovery in sight

Bitcoin (BTC) price continues to trade within a range-bound zone, hovering around $67,000 at the time of writing on Friday, and falling slightly so far this week, with no signs of recovery.