BNB Price Forecast: BNB’s Maxwell hardfork upgrade boosts bullish outlook
- BNB price breaks out of a falling wedge pattern, hinting at a bullish reversal.
- The Maxwell hardfork upgrade on BNB Smart Chain enables block times of 0.75 seconds and finality of 1.875 seconds.
- Positive funding rates and bullish momentum indicators support further upside potential.

BNB(BNB) price breaks out of a falling wedge pattern and trades above $656 at the time of writing on Tuesday, hinting at a bullish reversal. The successful completion of the Maxwell hard fork upgrade enhances the BNB Smart Chain’s performance with faster block times and quicker finality, thereby boosting investor confidence. Moreover, positive funding rates and strengthening momentum hint at a potential rally ahead.
BNB Chain completes Maxwell hardfork upgrade
BNB Chain announced on Monday that its Maxwell hardfork is complete. This major upgrade to the BNB Smart Chain reduces block times from 1.5 seconds to 0.75 seconds, improving network responsiveness, transaction speed, and validator performance. Additionally, fast finality is also achievable in ~1.875 seconds, improving confirmation time and consistency.

A review of the BscScan data shows a bullish outlook. The overview statistics for BSC show that new addresses, transactions, and network utilization have increased following the upgrade.
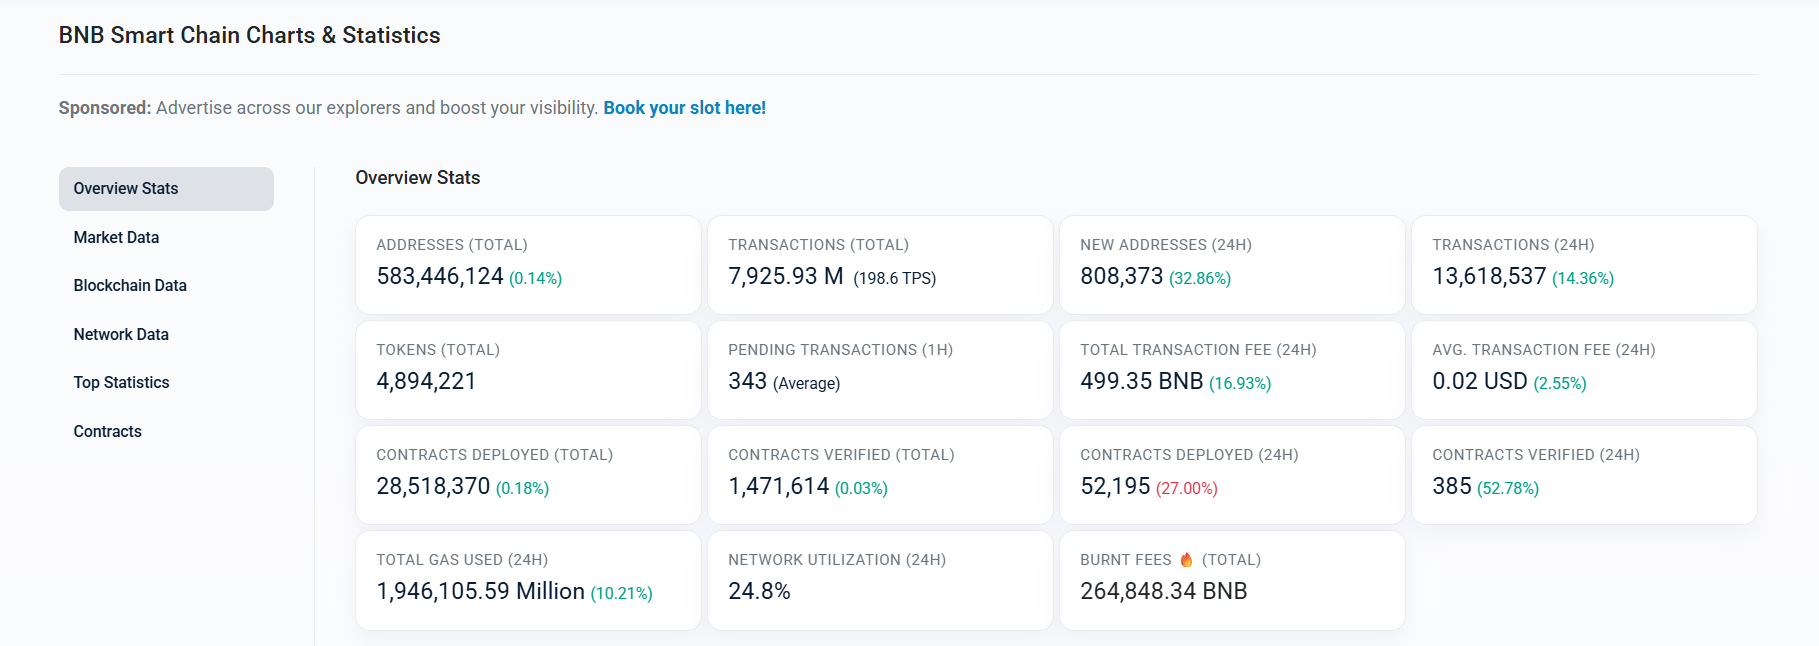
BNB Smart Chain overview stats chart. Source: BscScan
CoinGlass’s OI-Weighted Funding Rate data shows that the number of traders betting that the price of BNB coin will slide further is lower than that anticipating a price increase.
The metric flipped to a positive rate on Monday and stood at 0.0034% on Tuesday, indicating that longs are paying shorts and supporting the bullish outlook.
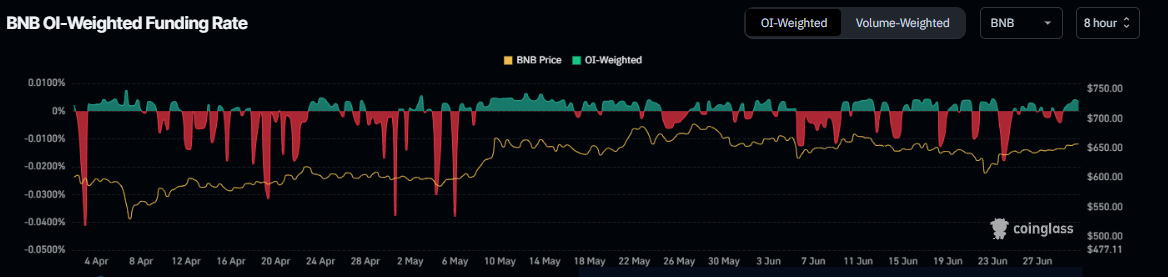
BNB funding rate chart. Source: Coinglass
BNB Price Forecast: BNB breaks above a falling wedge pattern
BNB price broke above the upper trendline of the falling wedge pattern on Saturday and rose nearly 2% until Monday. This pattern is formed by connecting multiple high and low levels with a trendline from mid-May; a breakout indicates a bullish bias. At the time of writing on Tuesday, it hovers around $657.
If BNB continues its upward trend, it could extend the rally toward its weekly resistance at $709.29.
The Relative Strength Index (RSI) on the daily chart reads 55, above its neutral level of 50, indicating that bullish momentum is gaining traction. The Moving Average Convergence Divergence (MACD) indicator also displayed a bullish crossover on Saturday, providing a buy signal and indicating an upward trend.
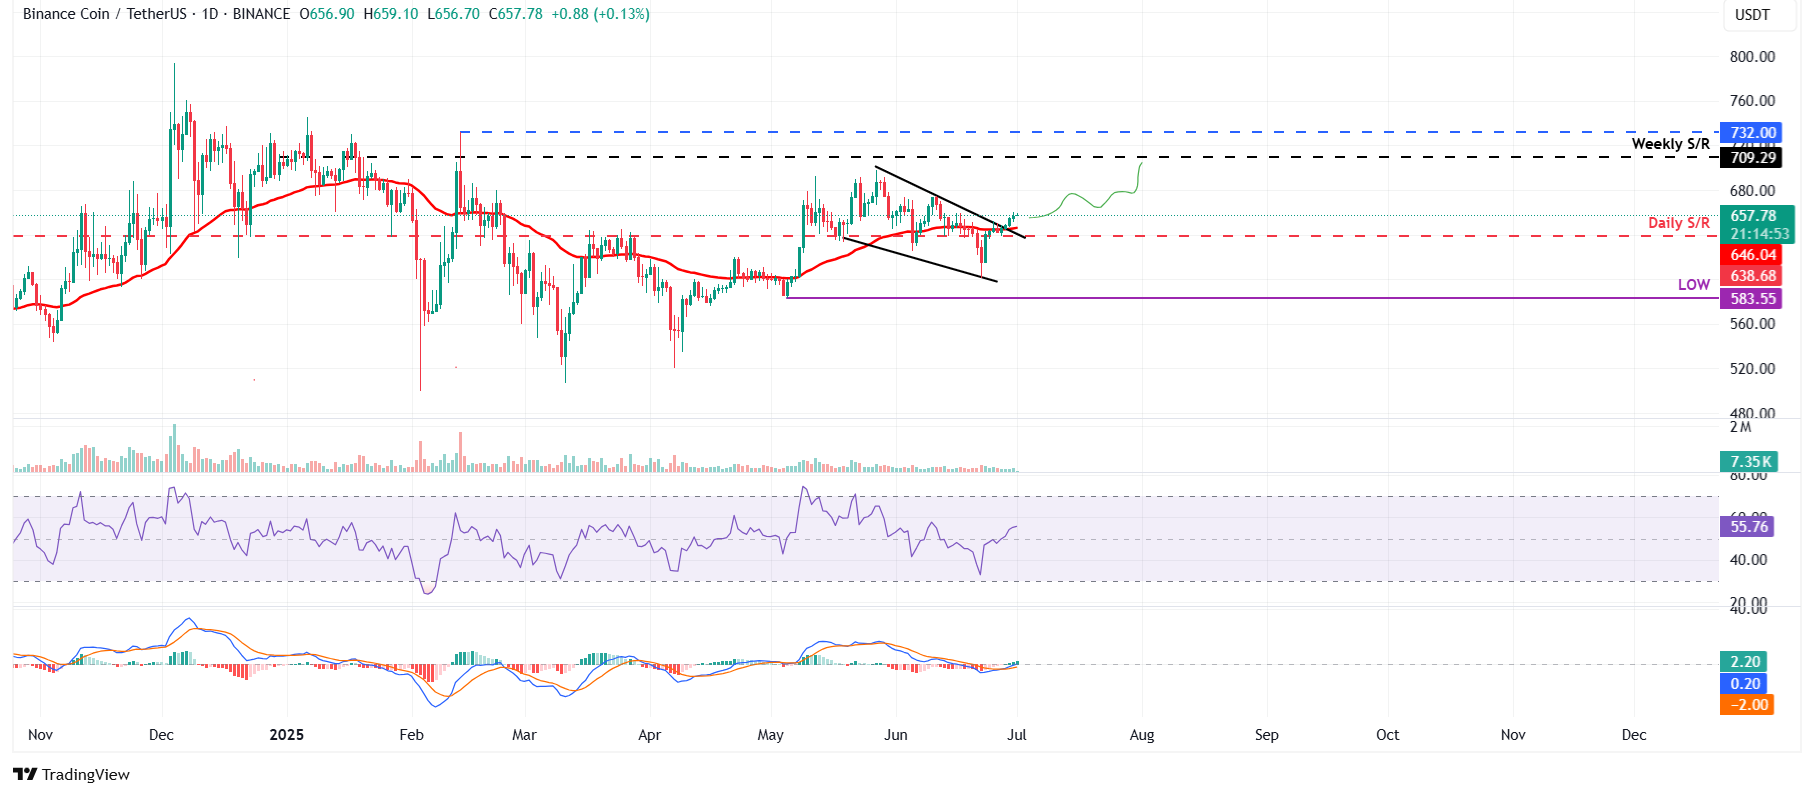
BNB/USDT daily chart
However, if BNB faces a correction, it could extend the decline to retest its daily support level at $646.04.
Author

Manish Chhetri
FXStreet
Manish Chhetri is a crypto specialist with over four years of experience in the cryptocurrency industry.