BNB Price Forecast: BNB loses strength as crypto market drops
- BNB edges lower by nearly 1% on Wednesday, extending the decline below the 200-day EMA.
- Derivatives data signals increased long liquidations and over 5% reduction in Open Interest, indicating a bearish shift in sentiment.
- The path of least resistance for BNB signals further downside risk toward $800.

BNB (formerly Binance Coin) loses ground as the broader cryptocurrency market falls, recording a 1% drop at the time of writing on Wednesday. Retail interest in the exchange token is declining, as evidenced by the massive wipeout of long positions and a decline in futures Open Interest. The technical outlook for BNB suggests further downside risk, as momentum indicators flash a sell signal.
Retail sentiment dims amid large liquidations
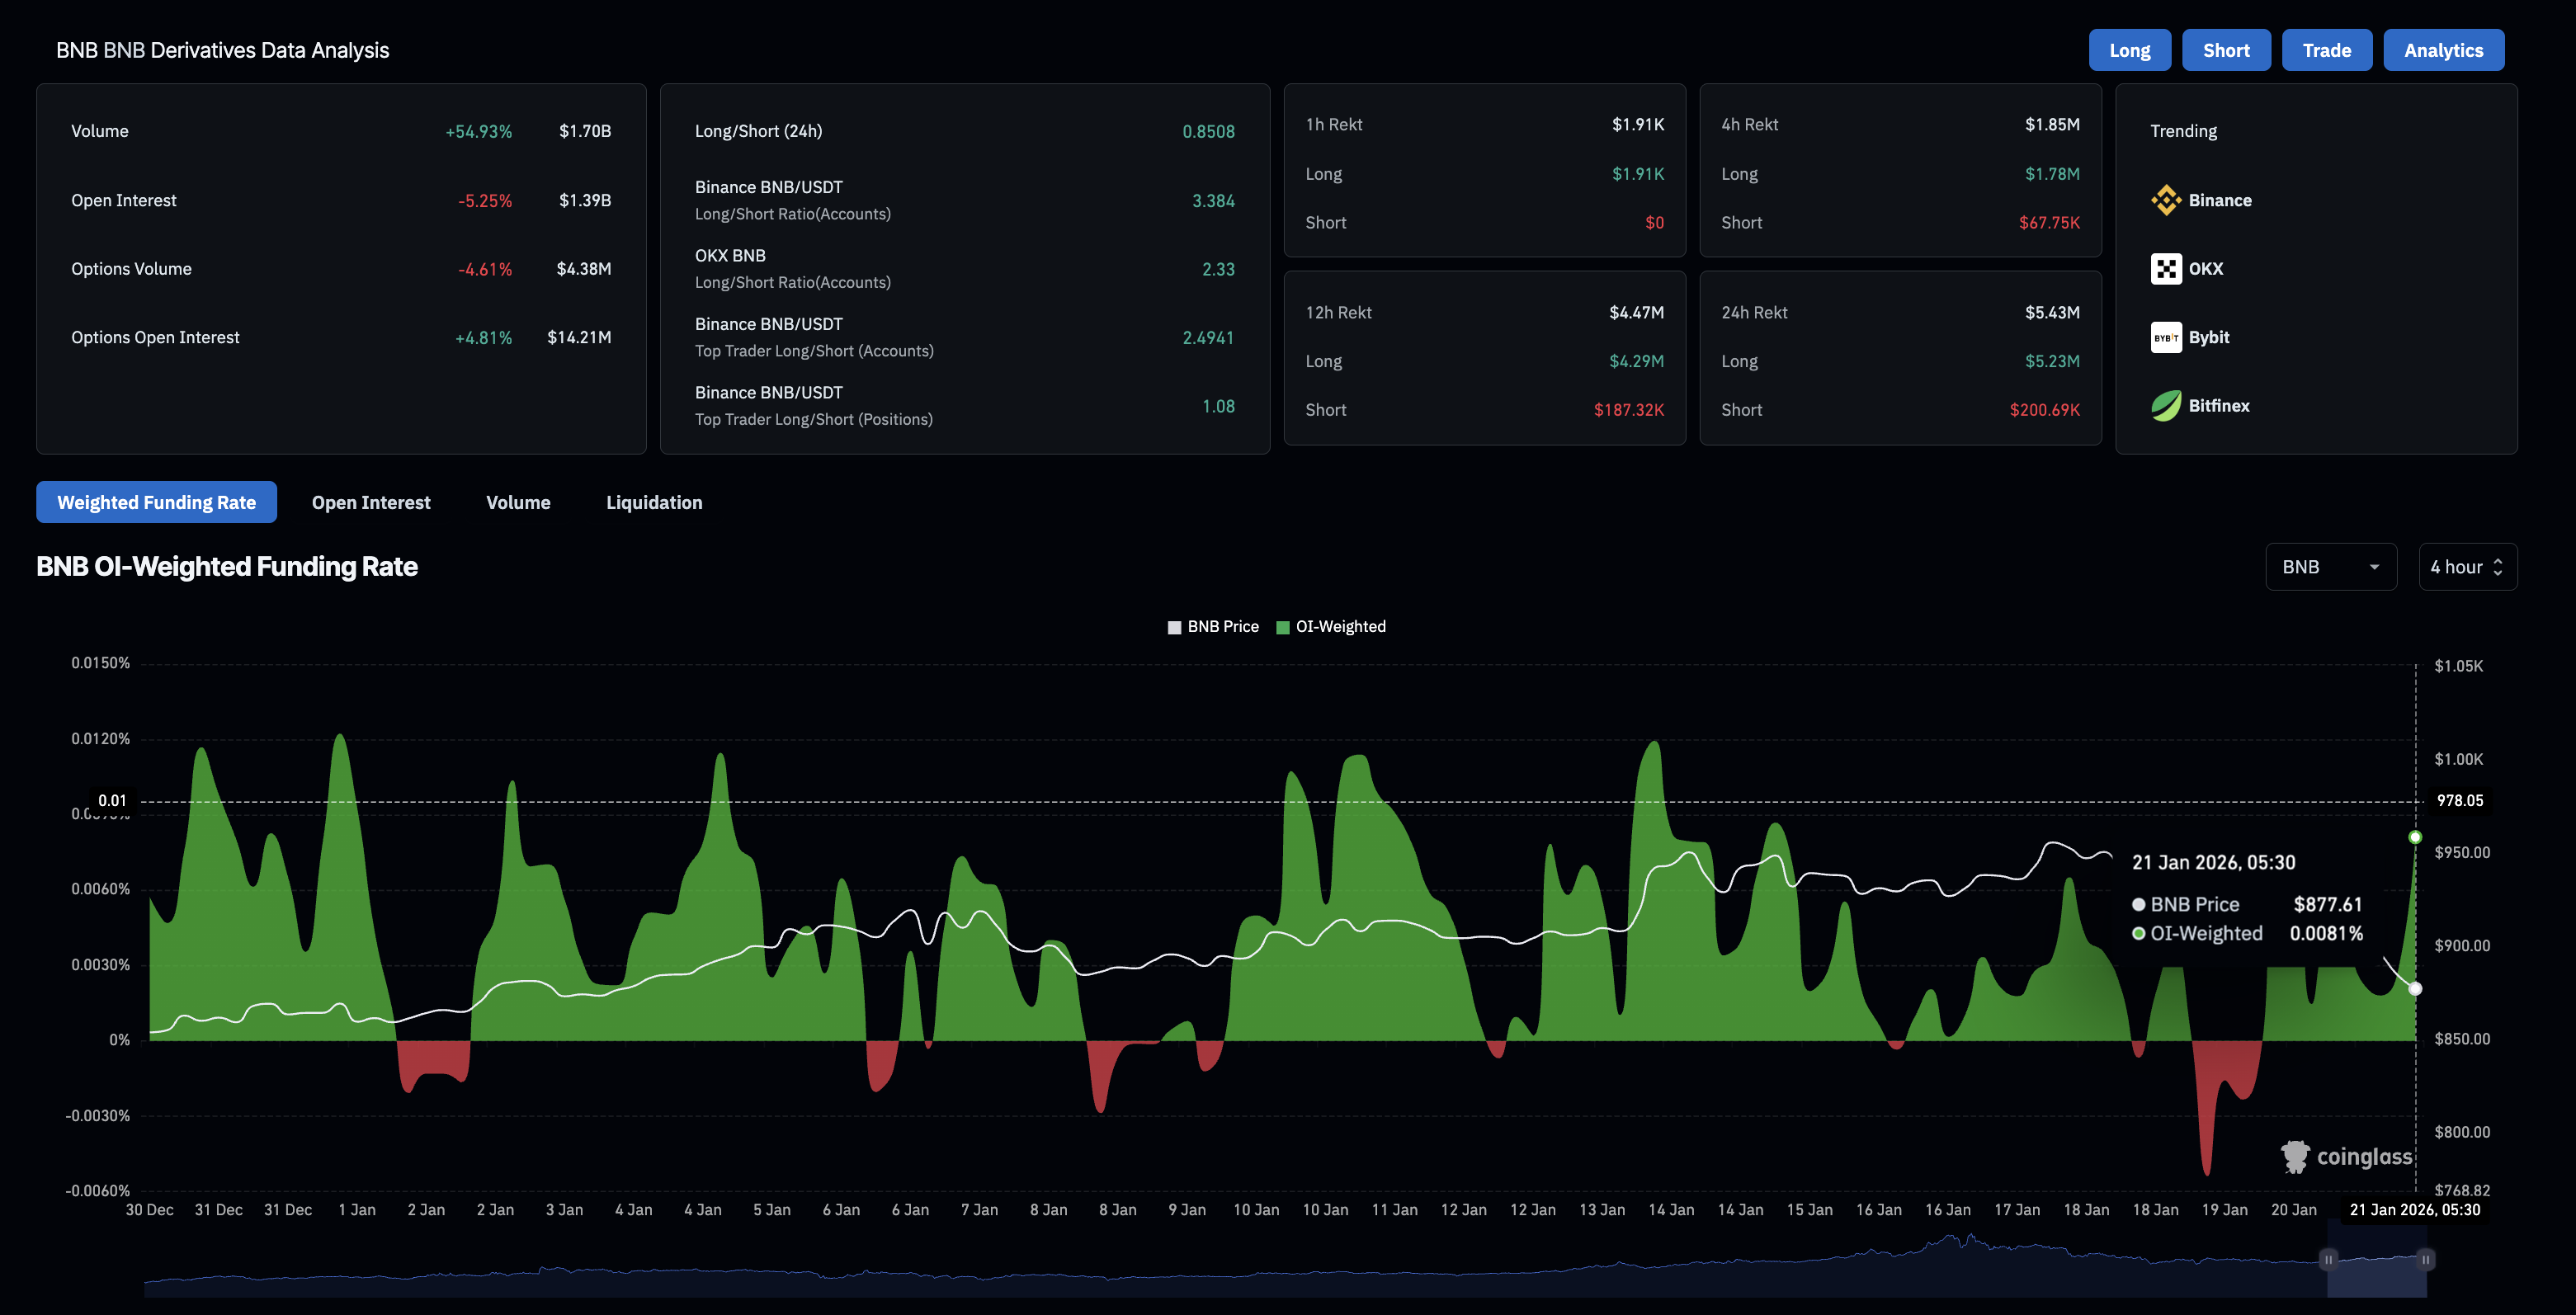
CoinGlass data shows that BNB Open Interest dropped by 5.25% to $1.39 billion over the last 24 hours, suggesting a decline in the value of outstanding futures contracts as traders close positions or reduce leverage.
A surge in long liquidations to $5.23 million over the last 24 hours, outpacing short liquidations of $220,690 by a wide margin, suggests that the wipeout of mostly bullish positions reduced capital exposure in BNB futures.
Technical outlook: Will BNB price crash to $800?
BNB price holds marginally below the 200-day Exponential Moving Average (EMA) at $883, while the 50-day EMA at $902 is sloping downward, suggesting a potential Death Cross.
The Moving Average Convergence Divergence (MACD) slips below the red line, races toward zero, widens the negative histogram, and suggests a surge in bearish momentum.
The Relative Strength Index (RSI) is at 42, crossing below the halfway line, indicating a surge in bearish momentum.
To reinstate an upward trend, BNB should resurface above the 200-day EMA at $883, which would improve the upside bias and target the 50-day EMA at $902.
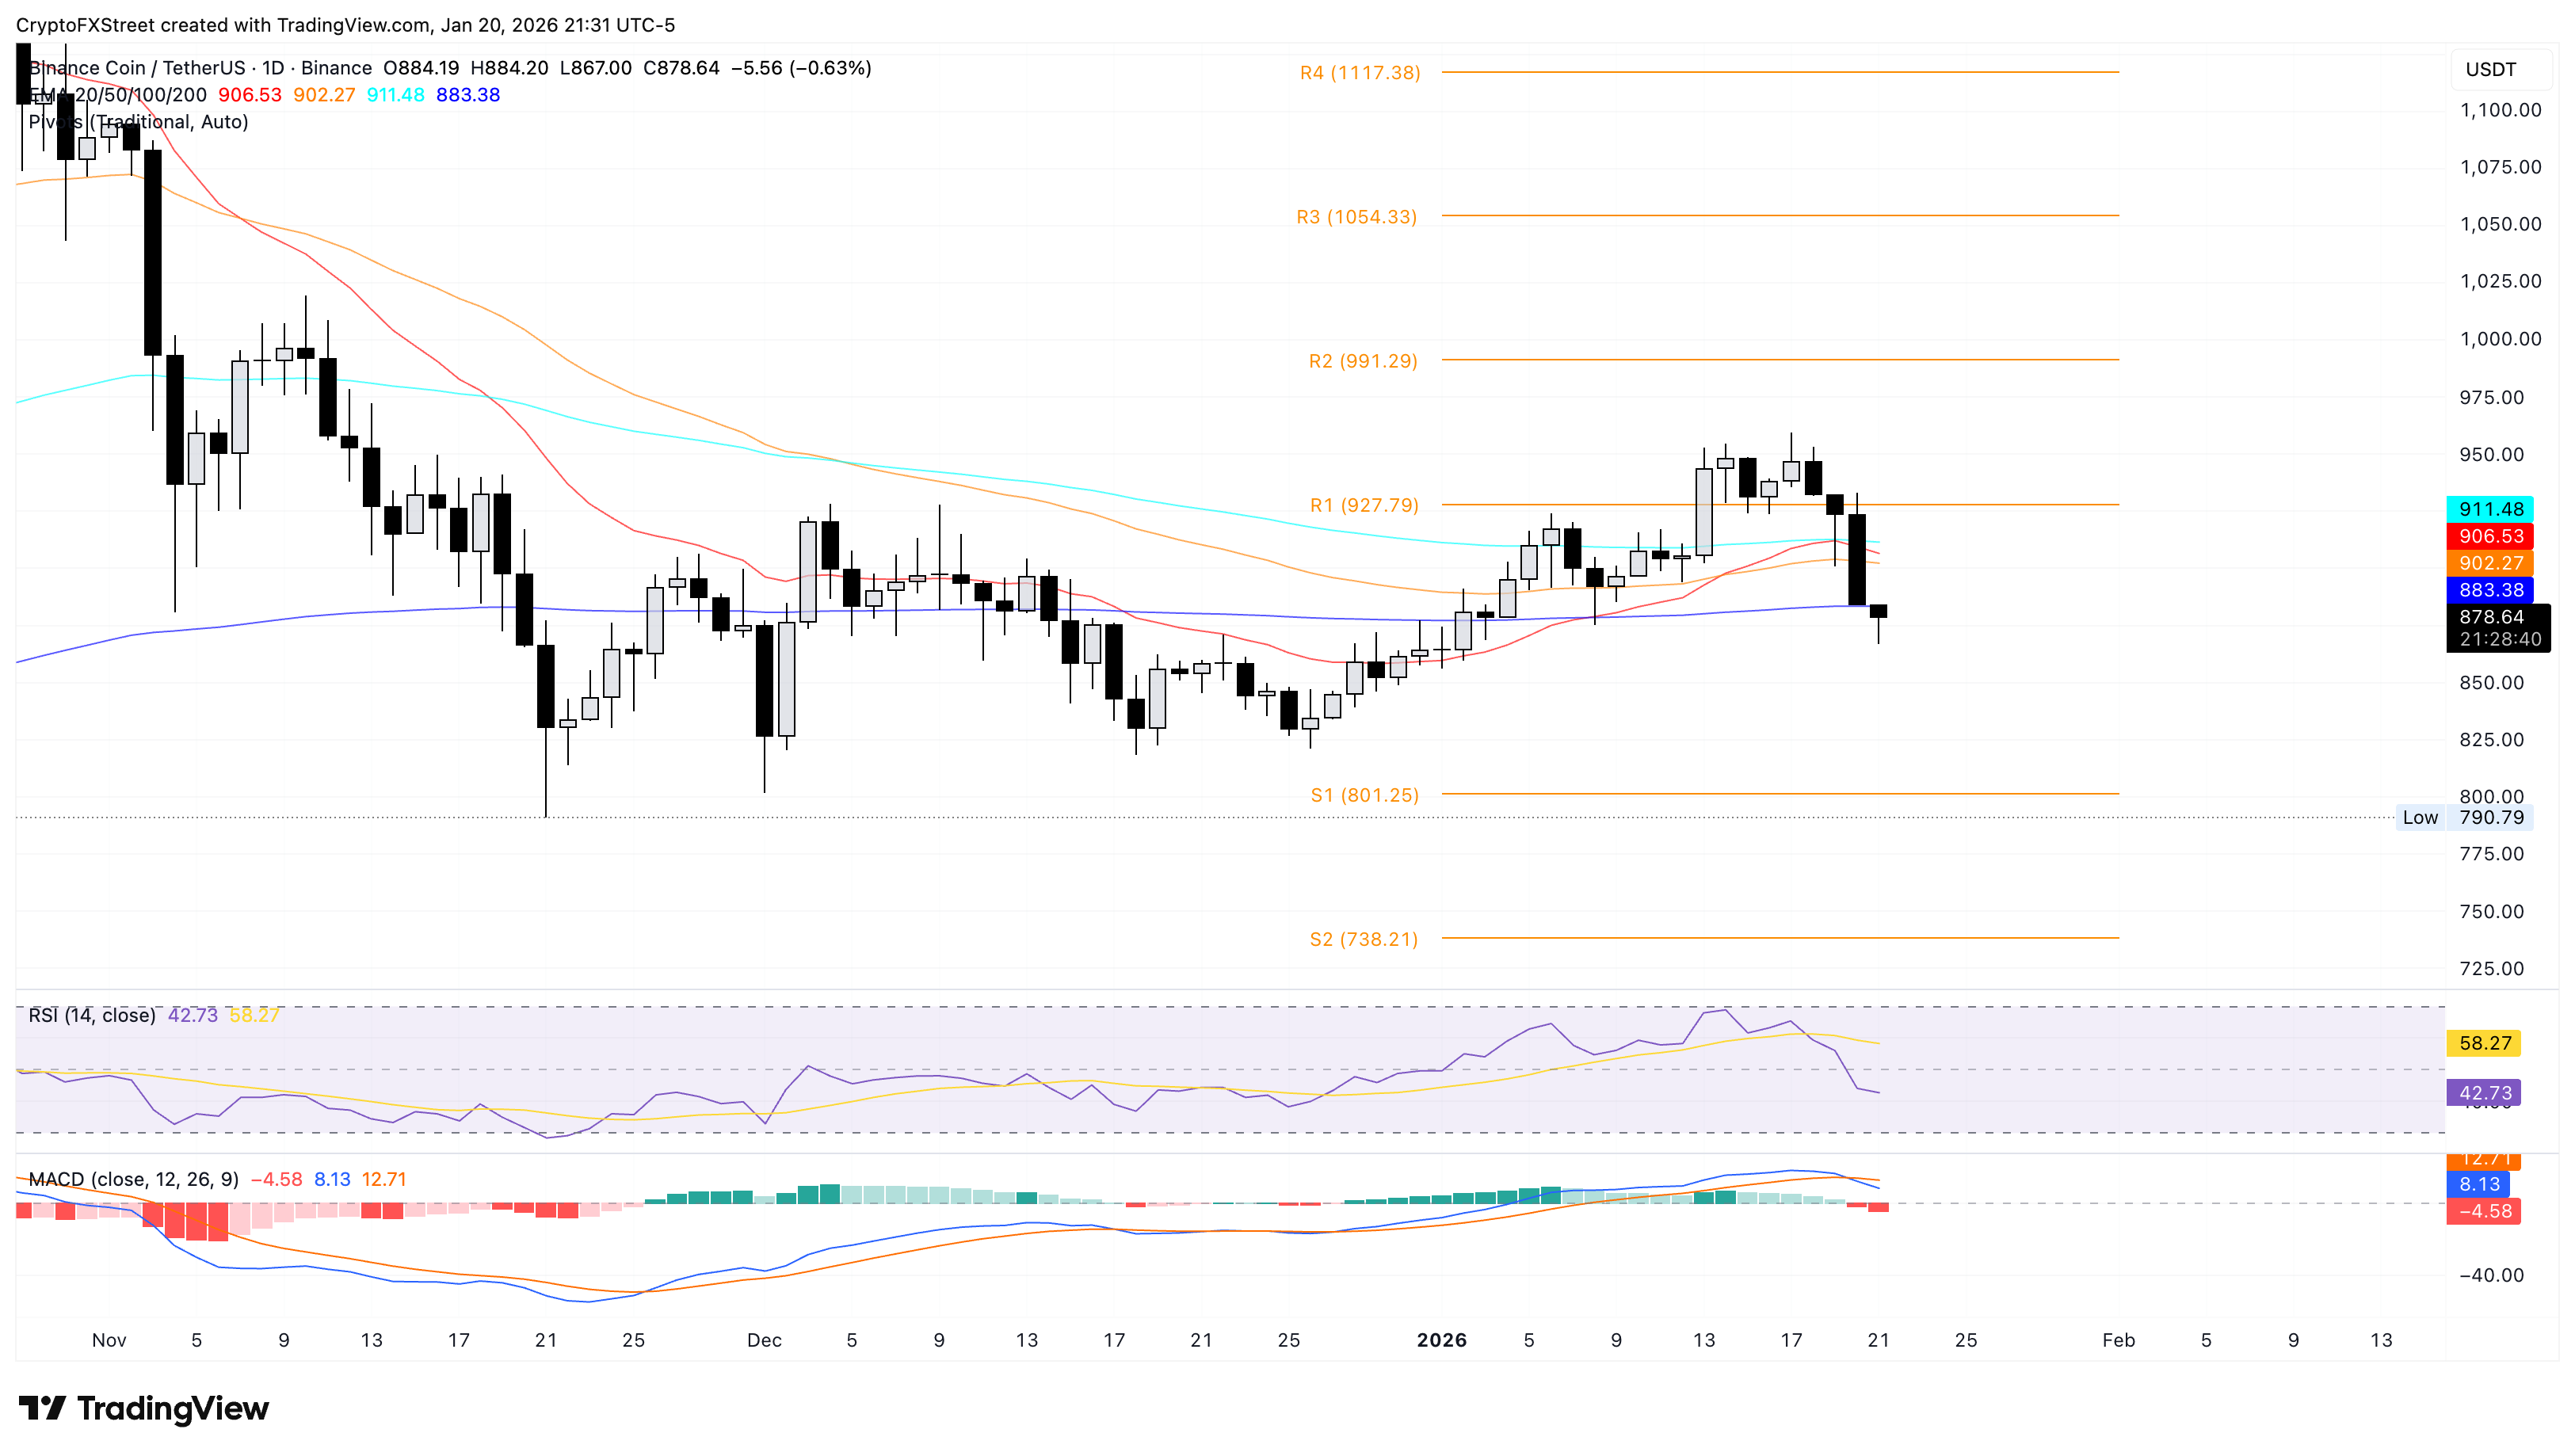
However, the path of least resistance targets the S1 Pivot Point at $801, consistent with the bearish shift in momentum.
(The technical analysis of this story was written with the help of an AI tool.)
Author

Vishal Dixit
FXStreet
Vishal Dixit holds a B.Sc. in Chemistry from Wilson College but found his true calling in the world of crypto.




