BNB Price Forecast: BNB extends losses as TRUMP threatens to strike Iranian power plants
- BNB price extends its losses on Thursday, paving the way to record its third consecutive week of losses.
- Risk-off sentiment strengthens as Donald Trump said the war will continue until late April, threatened to strike Iranian power plants, weighing on risky assets such as BNB.
- The technical outlook suggests a deeper correction, as momentum indicators signal a bearish trend.

BNB (BNB), formerly known as Binance Coin, is trading below $591 at the time of writing on Thursday, extending its three-week losing streak. The correction strengthened as the US President Donald Trump said the ongoing US-Iran war will continue until late April, weighing on investor appetite for riskier assets. On the technical side, momentum indicators suggest a deeper correction for BNB in the near term.
Trump’s comments dampen risk appetite
Addressing the nation on Wednesday, Donald Trump threatened that the ongoing war would continue until late April, threatened to strike Iranian power plants, and said Iran would be sent back to the “stone age” if no deal is reached.
This tempers hopes for de-escalation and investors’ appetite for riskier assets, bolstering the US Dollar (USD) and Oil prices while weighing on US equities and other risky assets. Bitcoin (BTC) slipped below $67,000 as of Thursday, with BNB following in BTC’s footsteps and falling below $591.
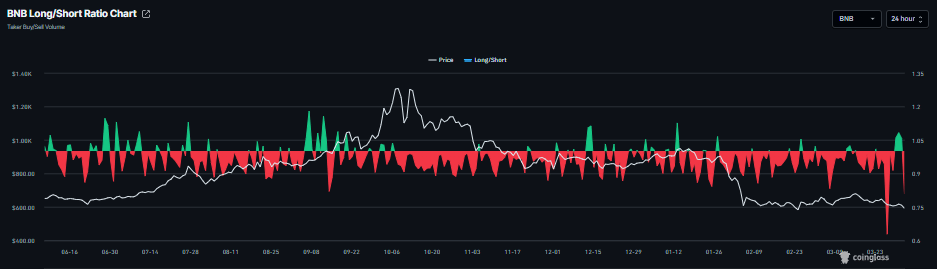
On the derivatives side, Coinglass’s long-to-short ratio for BNB stood at 0.80 on Thursday, near its lowest level in a month. The ratio below one indicates bearish sentiment in the market, as traders are betting on the BNB price to fall.
BNB Price Forecast: Nears February’s lows
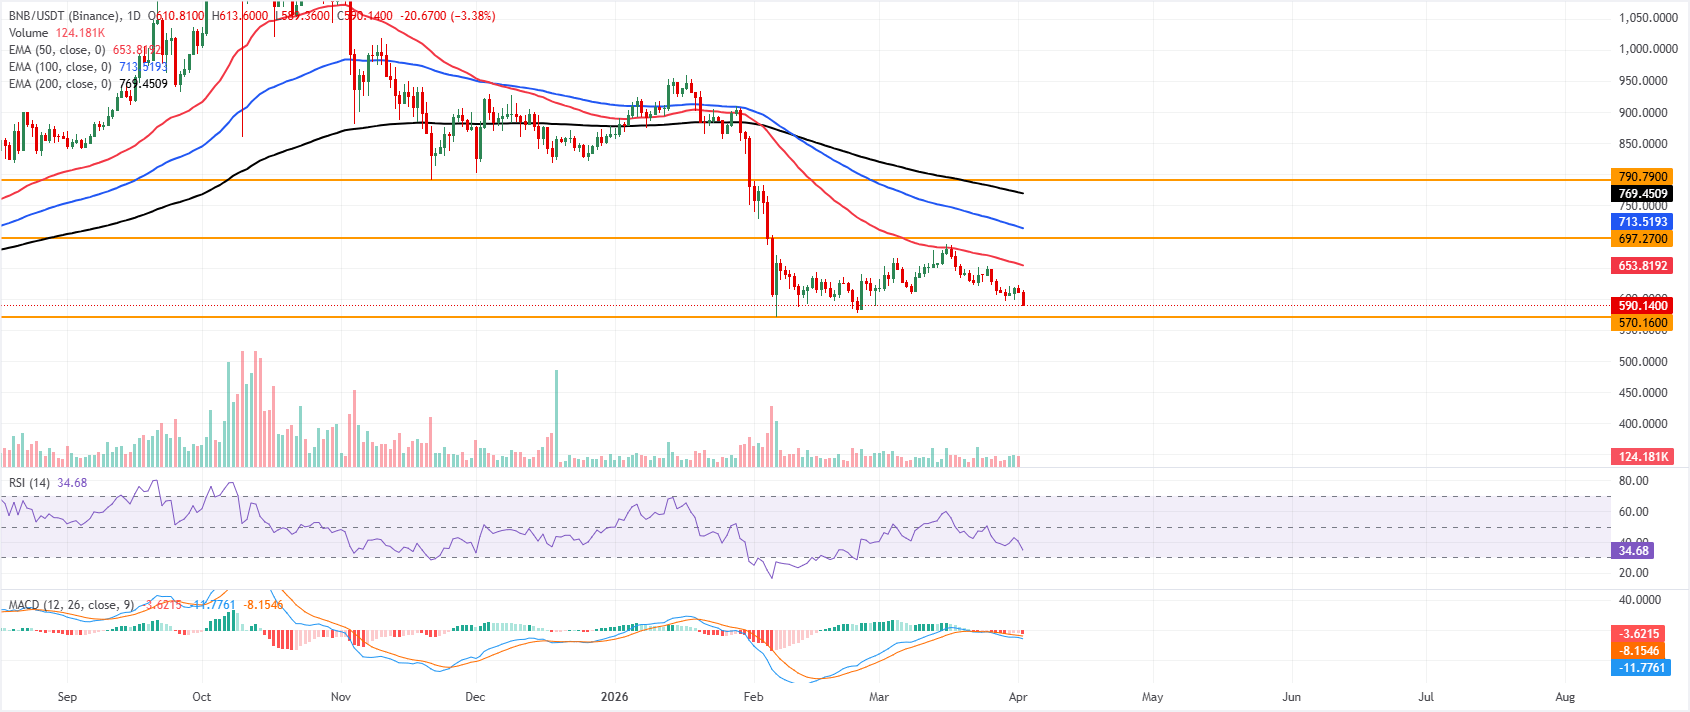
BNB price is trading at $590 on Thursday, losing over 3% so far this week. BNB holds well below the 50-day, 100-day and 200-day Exponential Moving Averages, which all trend higher above the current price and frame a broader bearish backdrop.
Momentum readings reinforce this pressure, with the Relative Strength Index (RSI) on the daily chart sliding toward the mid-30s and the Moving Average Convergence Divergence (MACD) drifting deeper below the zero line after a prior bull phase faded, signaling persistent selling pressure rather than a completed downside exhaustion.
Initial support stands at $570.16 (February’s low), where a break would open the way toward lower daily lows and deepen the corrective phase toward the key psychological level at $500.
On the topside, immediate resistance is near $697.27, in line with the descending EMAs that should cap rebounds on the first test. A sustained recovery above this barrier would be needed to ease the current bearish tone and expose the next resistance at $790.79, where prior congestion and the longer-term trend context converge.
(The technical analysis of this story was written with the help of an AI tool.)
Author

Manish Chhetri
FXStreet
Manish Chhetri is a crypto specialist with over four years of experience in the cryptocurrency industry.



