Solana Price Forecast: SOL mixed outlook caps breakout
- Solana price nears the key resistance on Wednesday, a breakout suggests a bullish move ahead.
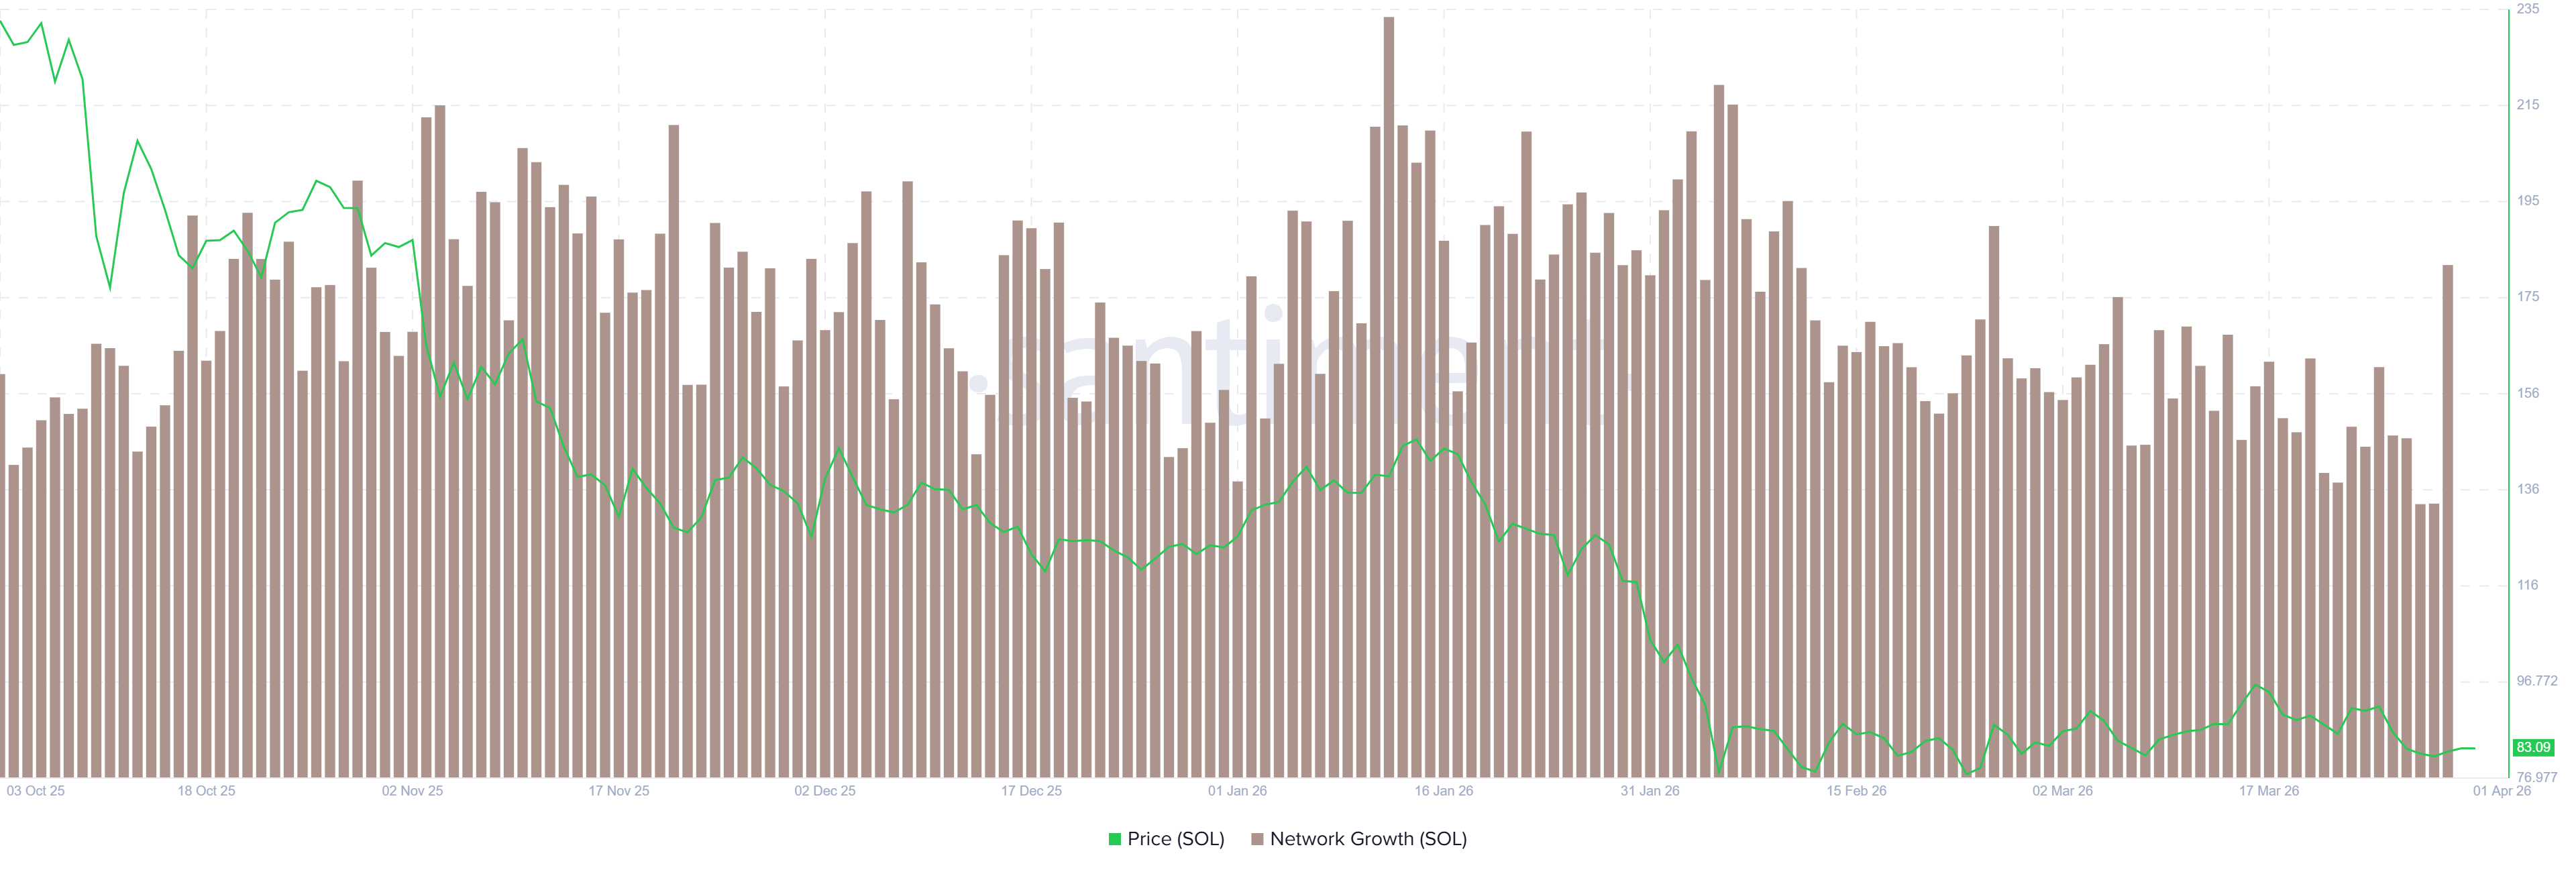
- On-chain sentiment is positive, with network growth hitting a monthly high amid cooling conditions.
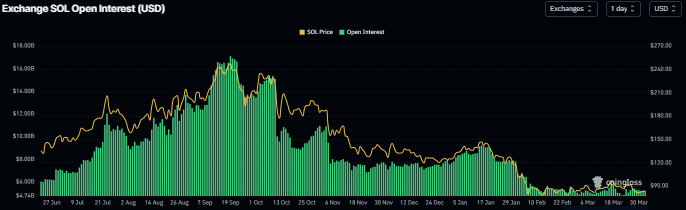
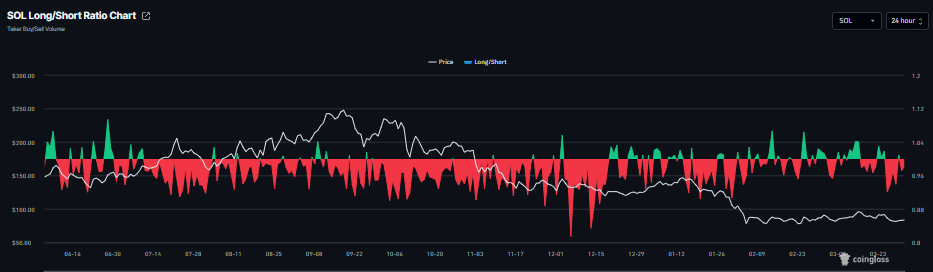
- Traders should remain cautious, as derivatives data shows bearish sentiment amid short bets and falling open interest.

Solana (SOL) is stabilizing at $83 at the time of writing on Wednesday, nearing a key resistance zone, where a breakout would signal an upside move. Improving on-chain activity supports a bullish case for SOL, while weakening derivatives metrics signal caution. These mixed signals cap a potential upside move.
On-chain data supports a bullish bias
Santiment data shows that Solana’s network growth index — a key metric tracking user adoption and project traction — surged to 1.25 million on Monday, the highest level since February 26. This elevated level highlights a broadly bullish outlook for SOL.
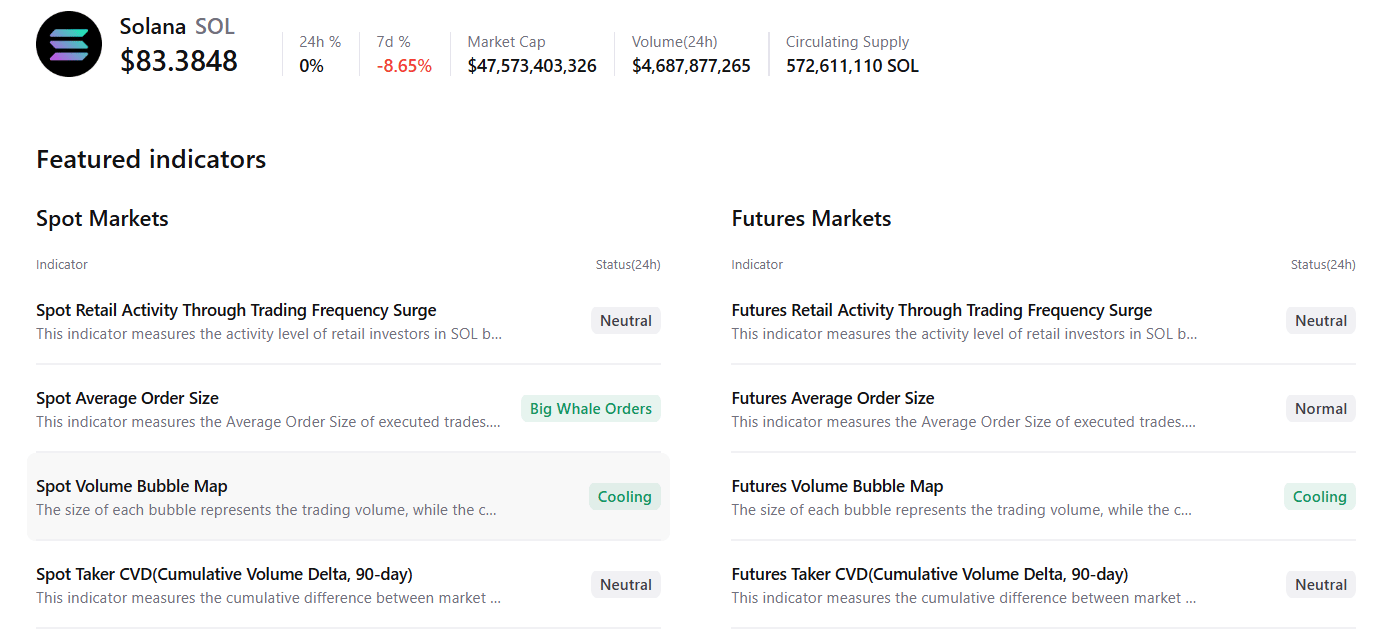
CryptoQuant summary data shows a neutral condition with a slight bullish tilt. Solana’s spot market shows large whale orders, and both markets indicate cooling conditions, with mostly neutral conditions across other metrics, suggesting a potential upside move.
Solana’s derivatives data shows cautious sentiment
Solana’s futures Open Interest (OI) dropped to $5.18 billion on Wednesday and has been steadily falling since the mid-January high of $9.16 billion. This drop in OI reflects waning investor participation and projects a bearish outlook.
In addition, CoinGlass’s SOL’s long-to-short ratio is currently at 0.98 on Wednesday. This ratio, being below one, reflects bearish sentiment in the markets, as more traders are betting on the asset price to fall.
Solana Price Forecast: SOL stabilizes above key support level
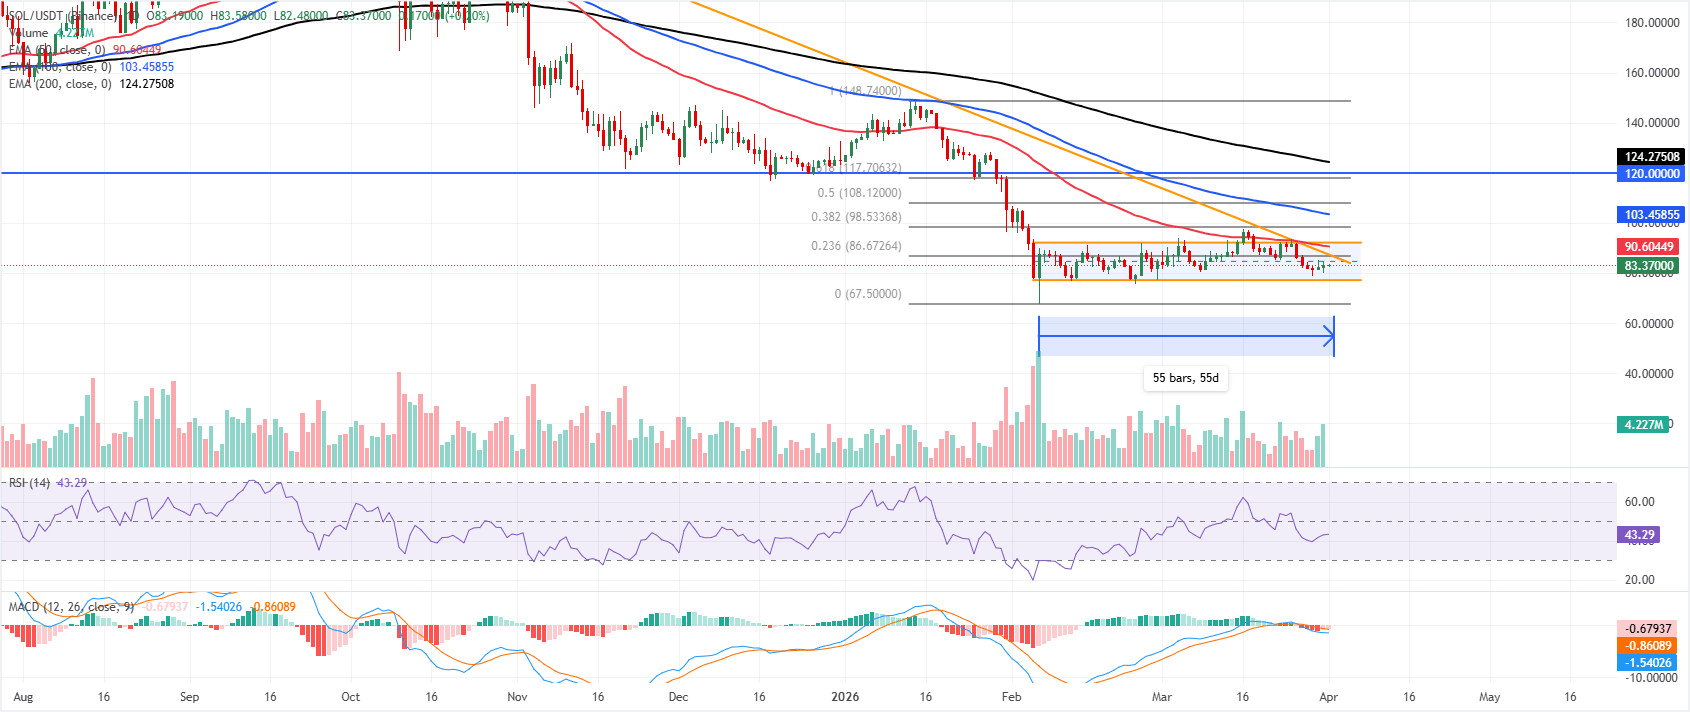
Solana price is trading at $83.36 on Wednesday, following a slight recovery earlier this week. The near-term bias remains mildly bearish as price holds within the horizontal channel spanning roughly $92.75 at the top and $77.12 at the lower boundary, with current trading levels leaning toward the lower half of that range. Daily closes remain well below the 50-day, 100-day, and 200-day Exponential Moving Averages, which are clustered between about $90 and $124, underscoring a dominant higher-timeframe downtrend.
Momentum is soft but not washed out, with the Relative Strength Index (RSI) on the daily chart hovering in the low-40s, while the Moving Average Convergence Divergence (MACD) indicator sits below its signal line and near the zero mark, reinforcing fading upside momentum rather than aggressive selling pressure.
Immediate support is located near the channel floor around $77.12, where a defense would keep the current corrective structure orderly, ahead of the Fibonacci origin area around $67.50 measured from the $67.50 low to the $148.74 high.
On the topside, the 23.6% retracement at $86.67 is the first cap, aligning closely with recent congestion, with the 38.2% retracement at $98.53 as the next resistance if buyers force a bounce. A daily close back above the 50-day EMA near $90.60 would be needed to challenge the broader bearish tone, while failure to reclaim $86.67 on rebounds would leave the focus on $77.12 and risk an extension toward lower supports.
(The technical analysis of this story was written with the help of an AI tool.)
Author

Manish Chhetri
FXStreet
Manish Chhetri is a crypto specialist with over four years of experience in the cryptocurrency industry.




