Hedera Price Forecast: HBAR risks deeper correction as bearish momentum accelerates
- Hedera price continues its decline on Tuesday, paving the way to record its third consecutive week of losses.
- Derivatives metrics back bearish sentiment, with falling Open Interest, rising short positions and negative funding rates.
- The technical outlook suggests a deeper correction as bearish momentum continues to build.

Hedera (HBAR) price continues its decline, trading below $0.087 at the time of writing on Tuesday, extending its three-week losing streak. Weakening derivatives alongside strengthening bearish momentum support a deeper correction for the HBAR token in the near term.
Hedera’s derivatives data shows a bearish outlook
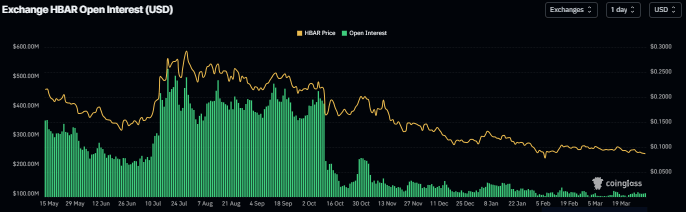
Hedera’s futures Open Interest (OI) dropped to $101 million on Tuesday and has been steadily falling since early November. This drop in OI reflects waning investor participation and projects a bearish outlook.
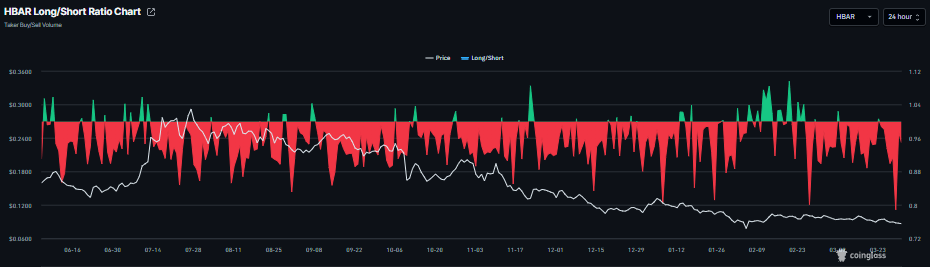
In addition, CoinGlass’s HBAR long-to-short ratio is currently at 0.94 on Tuesday, after reaching the lowest level of 0.78 the previous day. This ratio is still below 1, reflecting bearish sentiment in the markets, as more traders are betting the asset’s price will fall.
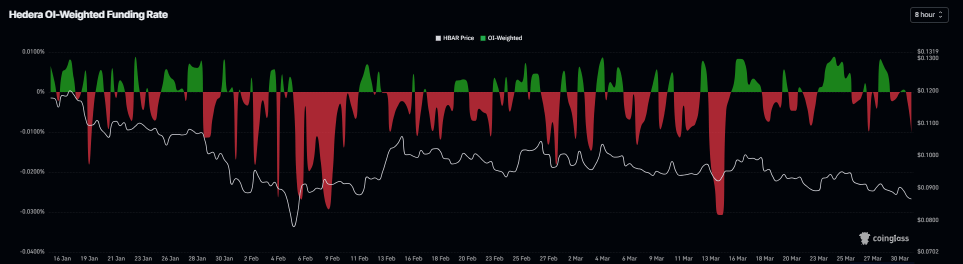
Funding rate data also point to a bearish outlook for Hedera. The metric flipped to a negative rate on Monday, reading -0.010% on Tuesday, indicating shorts are paying longs and suggesting bearish sentiment toward HBAR.
Institutional demand wanes
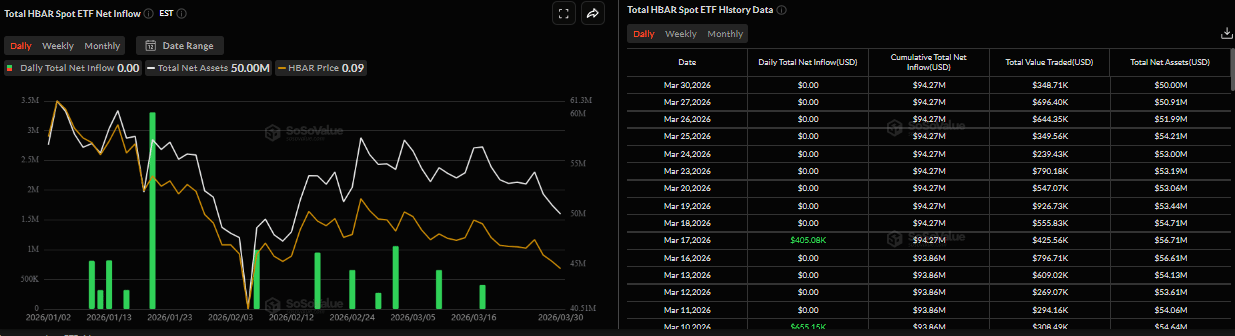
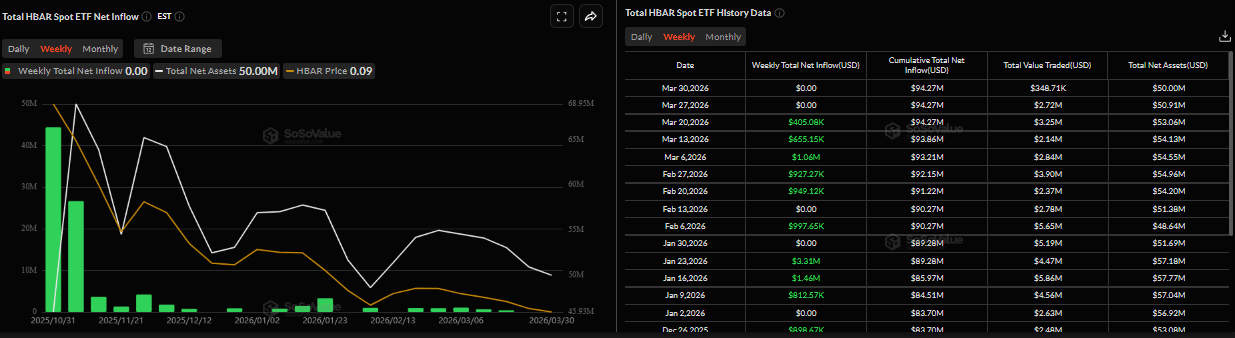
Institutional demand for HBAR has also remained silent, failing to support its price. SoSoValue data shows that the Hedera spot Exchange Traded Funds (ETFs) have been muted for the past two weeks, indicating that institutional investors are not willing to increase their exposure to HBAR amid the escalating Middle East war.
Hedera Price Forecast: Bears in control of the momentum
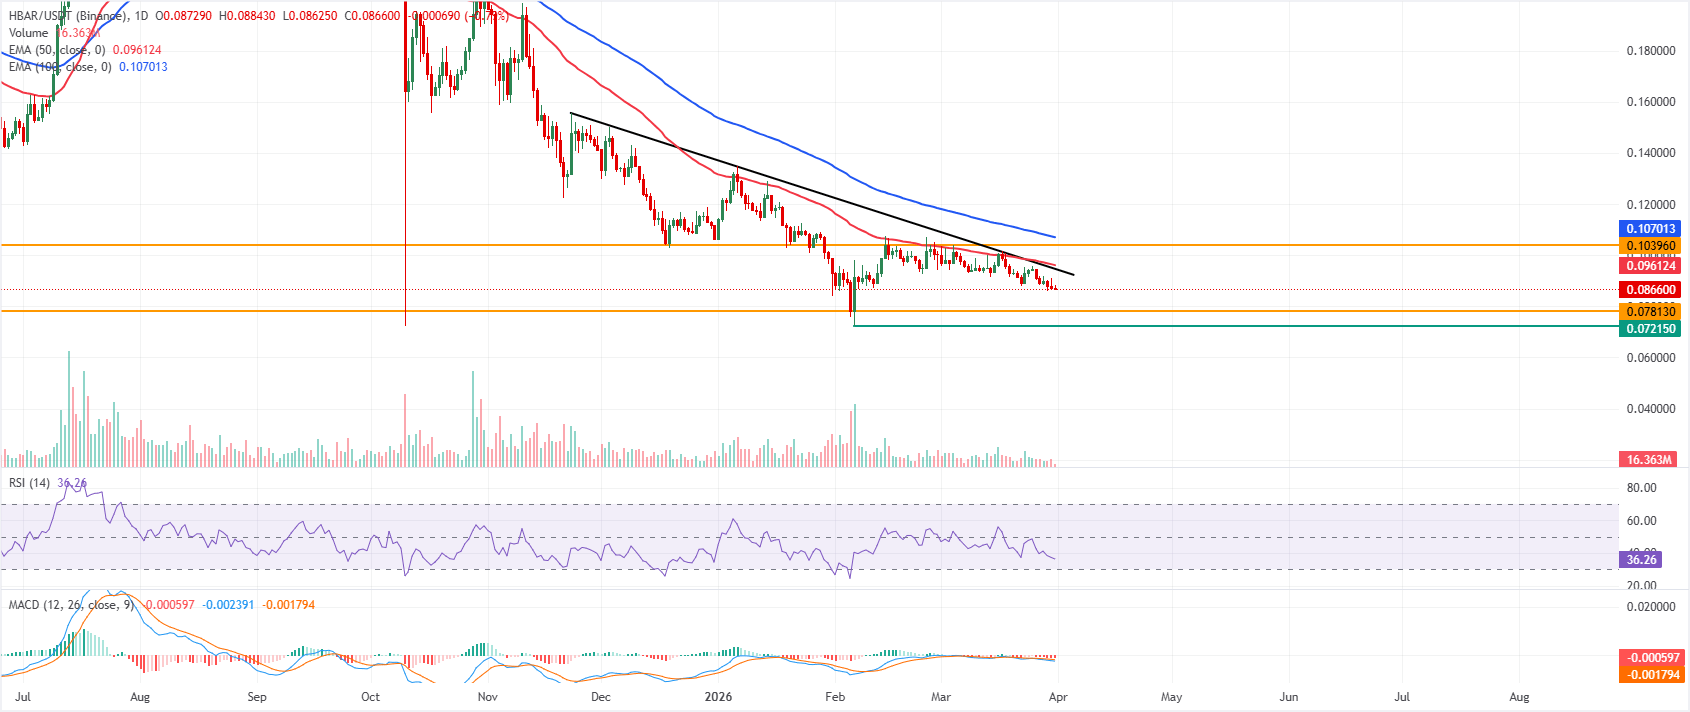
Hedera price is trading below $0.087 on Tuesday. The near-term bias is cautiously bearish as price extends its slide below the downward-sloping trendline from $0.155 and holds under the 50-day and 100-day Exponential Moving Averages (EMAs), which cap the upside around the mid-$0.09s to low-$0.11s.
The Relative Strength Index (RSI) on the daily chart near 36 stays below the 50 line, reflecting persistent selling pressure rather than oversold capitulation. The Moving Average Convergence Divergence (MACD) line is in negative territory, below its signal line, with a mildly expanding negative histogram, reinforcing fading bullish momentum and favoring further downside probes.
Initial resistance emerges near $0.095, where the prior trendline area converges with the descending 50-day EMAs at $0.096, followed by the horizontal resistance barrier at $0.104. A sustained push above $0.104 would be needed to challenge the broader bearish structure defined by the 100-day EMA at $0.107.
On the downside, minor support sits just above the January 31 low at $0.083, ahead of the more important horizontal floor at $0.078, which guards against a deeper decline. A decisive break below $0.078 would open the way toward Feburary 6 low of $0.072.
(The technical analysis of this story was written with the help of an AI tool.)
Author

Manish Chhetri
FXStreet
Manish Chhetri is a crypto specialist with over four years of experience in the cryptocurrency industry.



