Bitcoin’s CME gap at $9,600 could be filled soon after renewed selling pressure
- Bitcoin is currently trading at $10,560 after a notable price rejection from $10,800.
- News about BitMEX getting charged by the CFTC had a major impact on the price of BTC.

On October 1, one of the biggest cryptocurrency exchanges, BitMEX, was charged by the CFTC for illegally operating a cryptocurrency derivatives trading platform and for other anti-money laundering violations.
BitMEX has close to 200,000 Bitcoin inside its vault, close to $2 billion at current prices. The uncertainty surrounding the exchange has a negative and direct impact on the price of the flagship cryptocurrency.
A recent transaction of 50 Bitcoin is turning heads in the market because they were mined around the time of Satoshi Nakamoto, the creator of Bitcoin. Many people are speculating on whether this is a bullish sign or a bearish sign. Usually, coins mined back in 2010 are often associated with Satoshi; however, this is not always the case.
Yes 50 very old $btc just moved. As has happened 4 times in the past from the same time.
— Bitcoin Birch (@BitcoinBirch) May 20, 2020
IF they are selling, take comfort knowing they have a habit of selling before huge pumps
s/o @khannib for the tx ledger pic.twitter.com/nmbPmLzeOv
In fact, this is not even the first time old coins have been moved. According to a twitter user, it happened four more times in the past. Whether Satoshi, close associates, or someone that has nothing to do with them is moving the old Bitcoin, investors should remain calm as it most likely doesn’t indicate a bullish nor bearish sign.
Bitcoin bears looking at $9,600 after overall market weakness
Bitcoin, and the entire crypto market, suffered a mild crash that wiped close to $20 billion in market capitalization. BTC formed a futures gap on CME at $9,600 that hasn’t been filled yet, although it was close on September 5.
BTC/USD daily chart
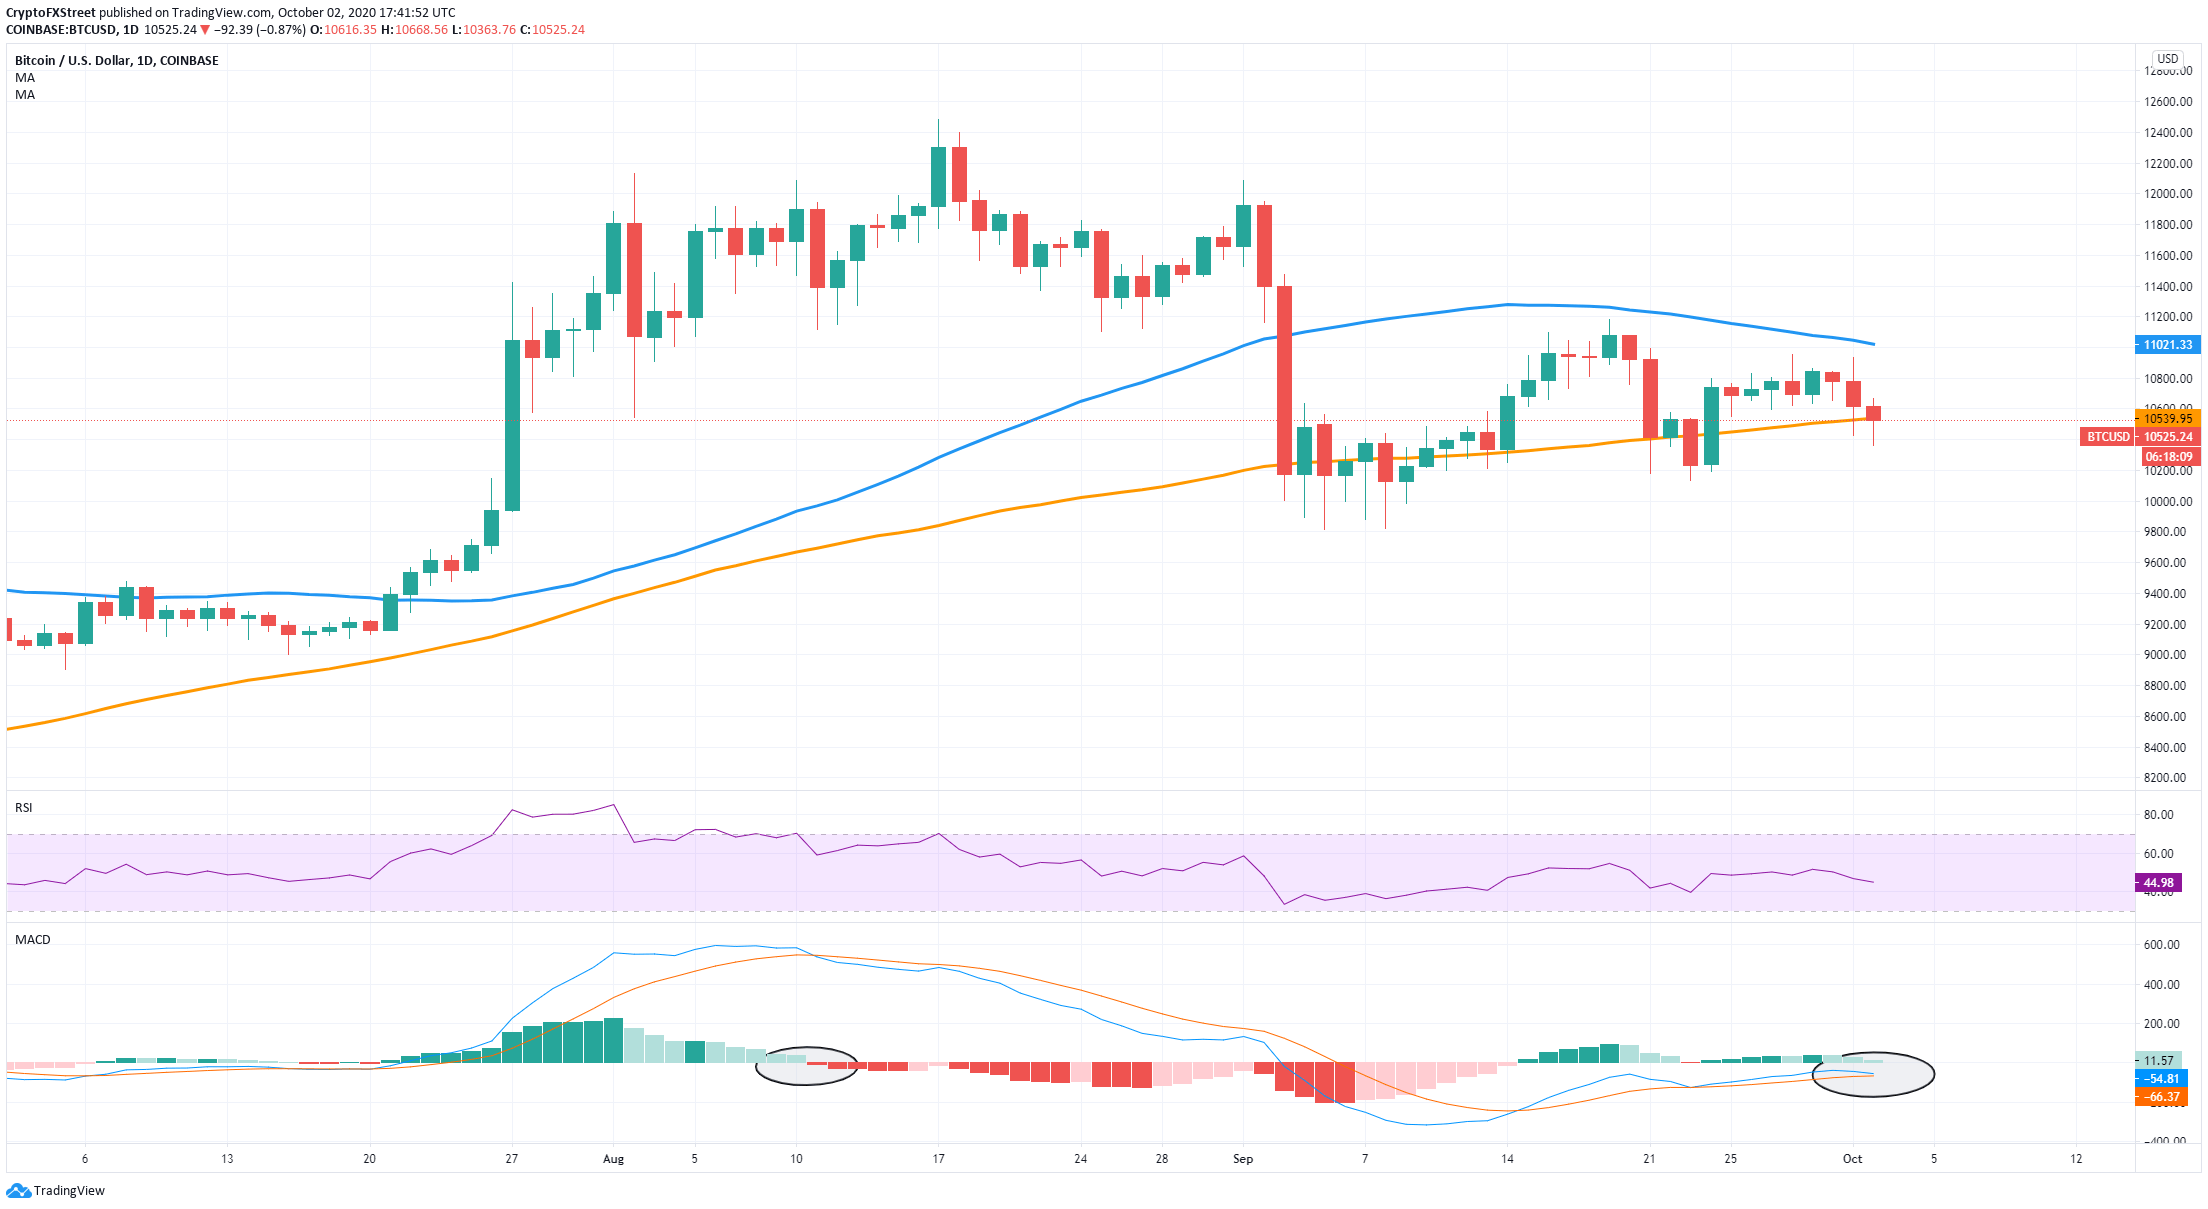
On the daily chart, the price is right above the 100-MA at $10,540, which is acting as a healthy support level. The MACD looks ready for a bear cross, the first real one since August 11. A crash eventually followed the previous bearish cross.
BTC IOMAP Chart
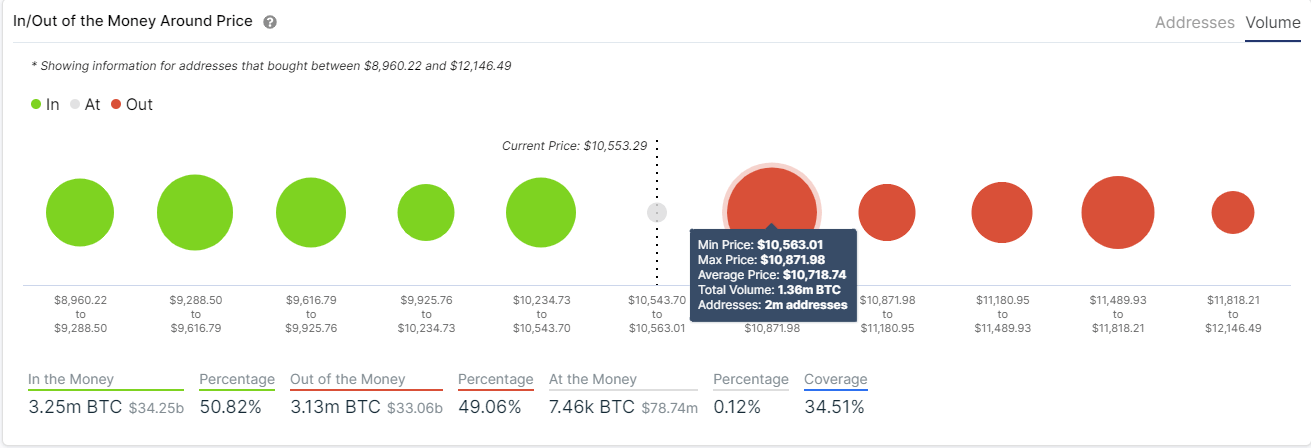
The In/Out of the Money Around Price chart by IntoTheBlock seems to confirm the current selling pressure. We can observe the range between $10,563 and $10,871 as a substantial resistance area. Between these two price levels, around 1.36 million BTC was bought from 2 million different addresses.
We know this is a robust resistance area because the range between $10,234 and $10,540 only has 680,000 Bitcoin and 1 million addresses.
BTC/USD 4-hour chart
-637372580942530687.png)
Bitcoin's weakness is more apparent on the 4-hour chart, which is close to presenting a sell signal through the TD sequential indicator. Additionally, the 50-SMA and the 100-SMA are on the verge of a bearish cross while the MACD has already turned bearish in the past 24 hours.
We have seen that $10,000 is a critical support level defended several times between September 4 and September 8. However, if selling pressure keeps mounting, a bearish breakout below $10,000 will take BTC down to $9,600 to fill the CME gap.
On the other hand, while the area between $10,563 and $10,871 is robust, a bullish breakout can push Bitcoin towards $11,000 again.
BTC Holders Distribution Chart
 [19.46.54, 02 Oct, 2020]-637372581041439036.png)
For instance, the number of new whales holding between 10,000 and 100,000 Bitcoin has increased from a low of 104 on September 14 to a current high of 111, a significant growth.
Author

Lorenzo Stroe
Independent Analyst
Lorenzo is an experienced Technical Analyst and Content Writer who has been working in the cryptocurrency industry since 2012. He also has a passion for trading.


