Bitcoin Weekly Forecast: BTC/USD bulls wake up from hibernation, don't let them fall asleep again
- Bitcoin has attempted a recovery, however, the upside momentum is not as strong as it was supposed to be.
- The on-chain statistics confirm the improvement, but we still need to see a move above $10,000.
- The technical picture implies that BTC/USD may stay sidelined in a new range before another recovery attempt.

Bitcoin made its way out of the range finally. The first digital coin settled above 50-day SMA, which is a great technical improvement and a hope for Bitcoin bulls who set their eyes on new highs. While the optimism is growing stronger, we still need to grope with lots of technical barriers and fundamental setbacks.
Bitcoin's on-chain stats improved together with the price increase. The coin broke free from a claustrophobic channel, however, nothing spectacular happened as many analysts expected. The high sense of uncertainty limits Bitcoin's bullish potential and makes traders and investors caution at least until it is clear that the bulls are back behind the wheel.
As we have already reported earlier, 82% of Bitcoin holders are making money at the current BTC price against 69% registered a week ago. The number of large transactions has been rising, however, he trading activity remained subdued, while the volatility glued to the multi-month lows. In the previous weekly report we mentioned that Bitcoin's 30-day volatility decreased to 20%, which was the lowest level since March 2019. Now it is 18.34%.
Bitcoin's fundamental factors
The first digital currency is consistently immune to anything happening in the bigger world, however, the negative sentiments on the global markets have a tendency to influence Bitcoin. Thus, the escalation of the Din-American conflict pushed the stock indices from the recent highs and stopped BTC recovery. Weak economic data is another concern. A growing number of jobless claims in the US implies that the world's largest economy may not recover as quickly as it was hoped.
The global central banks, including FED are on the alert and ready to inject more money into the financial system. As the theory goes, the inflationary consequences of fiscal and monetary stimulus attract investment inflows into the cryptocurrency industry as investors seek to protect their wealth from depreciation. However, there is no real evidence to support the theory.
BTC/USD: Technical picture
On a weekly chart, Bitcoin (BTC) has printed the biggest green candle since the end of May, which is a positive signal in the long run. The weekly RSI has reversed to the upside, however, the price is still moving within a long-term channel limited by $10,000 on the upside. Once it is out of the way, the upside is likely to gain traction with the next focus on the previous recovery high at $10, 414 and the highest level of 2020 at $10,512.
The critical support is created by the lower boundary of the above-mentioned channel at $8,750. It is closely followed by downward-looking weekly SMA50 currently at $8,600. This technical level has been limiting Bitcoin's decline since the beginning of May and now it is the backstop that separates the downside correction from the outright bearish trend. and now it creates the lower line fo the consolidation channel. The MA has started to reverse to the upside which means the market may be in a better position for further upside.
Once the above-said support level is broken, the sell-off may be extended towards $8,500 (daily SMA200) and $8,350 (the middle line of the weekly Bollinger Band). It is followed by the psychological $8,000 and weekly SMA100 above $7,300.
BTC/USD weekly chart
-637312014025676373.png)
The daily chart confirms the positive development and implies that the price may retest the upper boundary of the channel within the foreseeable future. The local support is created by the psychological $9,000, which is reinforced by 100-day SMA and the daily line of the daily Bollinger Band located marginally below this area. Once it is out of the way, the sell-off is likely to gain traction with the next focus daily SMA200 at $8,550.
BTC/USD daily chart
-637312014461320581.png)
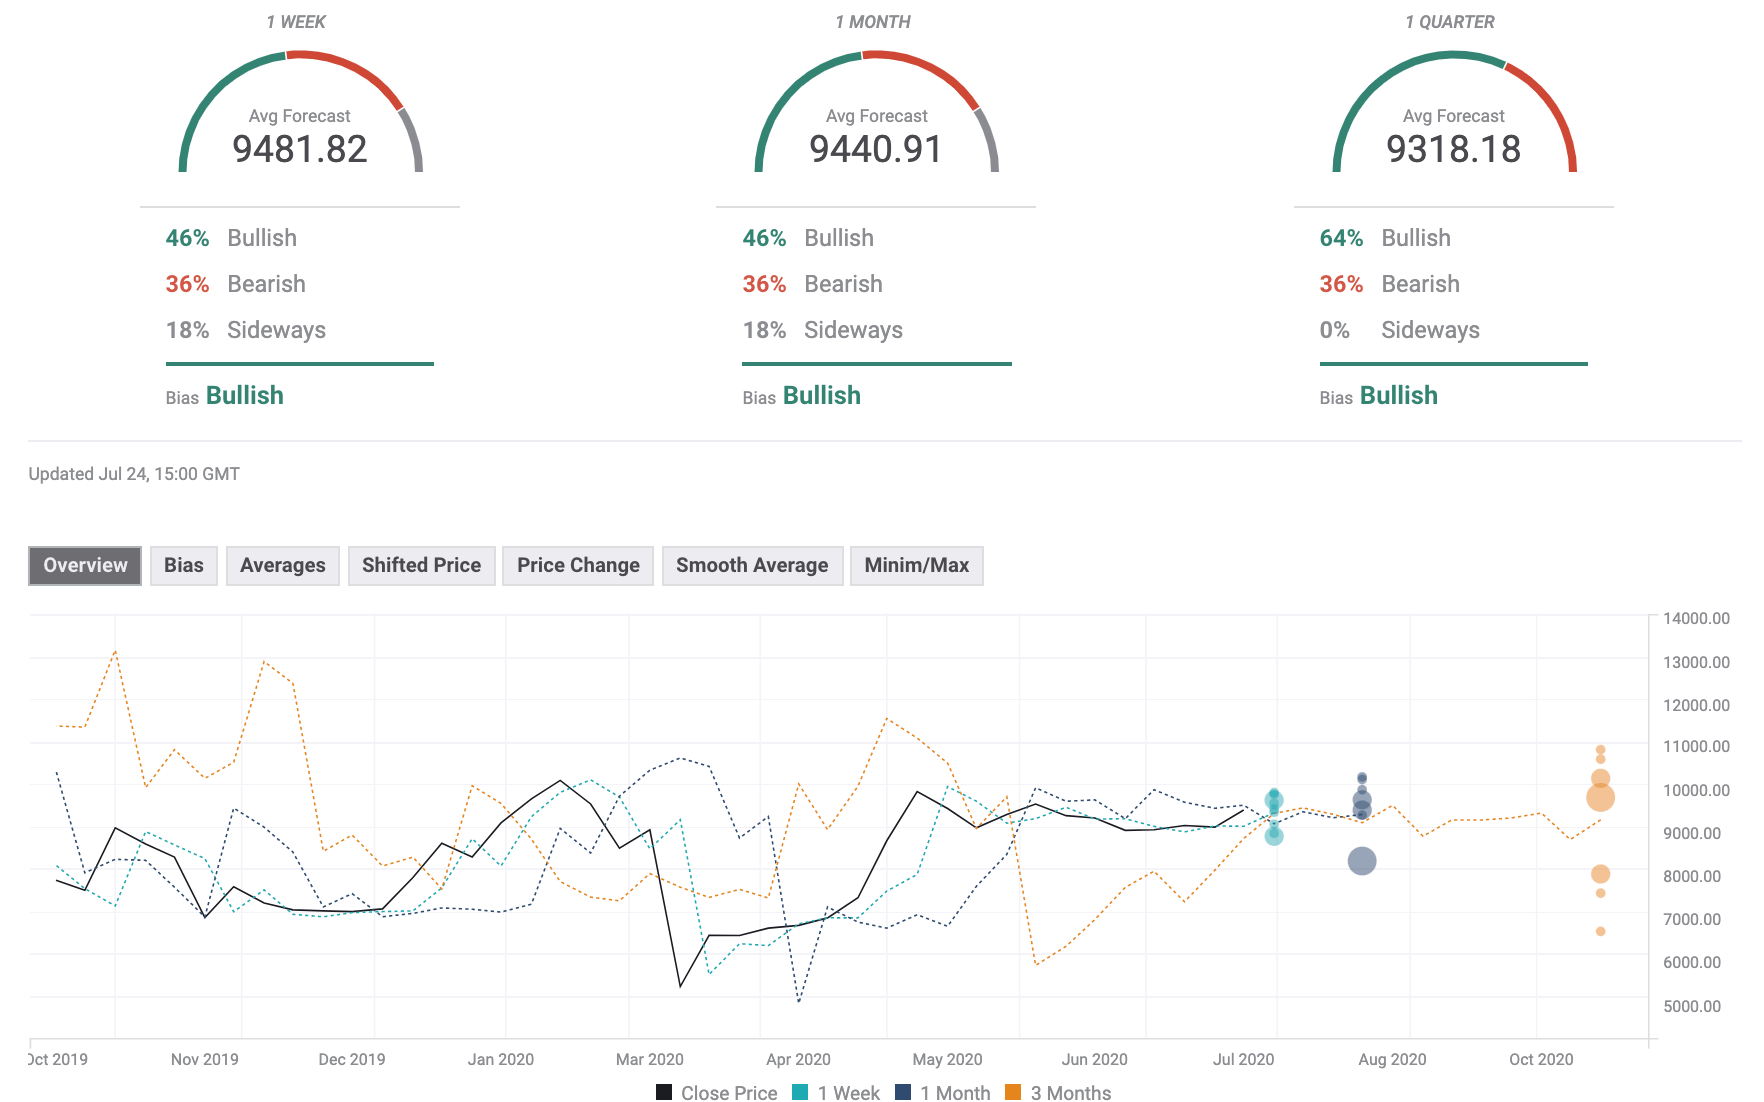
The Forecast Poll has improved since the previous week as expectations on all timeframes are bullish now. The market sentiments have changed even on a quarterly basis, where it stayed bearish for several weeks in a row. Notably, the weekly price expectations returned below $10,000 after a dramatic jump above $15,000; both monthly and quarterly forecasts are also below $10,000. It means that the experts bet on the short-term price increase within the long-term consolidation trend.
Author

Tanya Abrosimova
Independent Analyst


