Bitcoin Weekly Forecast: $12,000 turns into a do-or-die level for BTC/USD
- Bitcoin remains range-bound as the recovery is limited by $11,500.
- Fed's monetary policy may be supportive of BTC in the long-run.
- The weekly chart implies that the long-term risks are tilted to the downside.

Bitcoin (BTC) experienced a sharp sell-off on Tuesday, August 25, and has been struggling to recover above $11,500 for the best part of the week. While the first digital coin managed to regain the ground after a sell-off below $11,300, the upside momentum seems to be fading away on approach to the above-said local resistance. At the time of writing, BTC/USD is changing hands at $11,440, mostly unchanged on a day-to-day basis and down nearly 3% since this time a week ago.
Reaction to the Fed was short-lived
The cryptocurrency market waited for the annual speech of Federal Reserve's chairman in hopes to see the updated monetary policy approach would serve as a trigger to Bitcoin's rally. In fact, the US central banker confirmed that the rates would stay low in the foreseeable future, while the bank would be ready to turn a blind eye to longer periods of high inflation. In short, the Fed will stand ready to pump money into the financial system even if prices start to grow.
This major policy shift pushed the US Dollar in a tailspin. The greenback headed for its worst daily decline in three months against a basket of its peers, while stock markets and gold enjoyed healthy gains. Bitcoin jumped above $11,500 for a fraction of time and dropped back inside the range.
While the short-term players felt disappointment and frustration, longer-term bulls still believe that the inflationary policy of the US central bank will eventually support massive Bitcoin rally. As the FXStreet previously reported, the founders of the cryptocurrency exchange Gemini, Winklevoss brothers, published a lengthy story explaining how Bitcoin would reach $500,000 and why it is the only reliable long-term protection against inflation.
Inflation is coming. Money stored in a bank will get run over. Money invested in assets like real estate or the stock market will keep pace. Money stored in gold or bitcoin will outrun the scourge. And money stored in bitcoin will run the fastest, overtaking gold.
They also admitted that Bitcoin is still at the early stages and may have some technological risks and political risks; however, in the long run it will overtake all other assets that are considered safe-haven now.
Nonetheless, we believe that bitcoin will continue to cannibalize gold and that this story will play out dramatically over the next decade. The rate of technological adoption is growing exponentially. Software is eating the world and gold is on the menu.
BTC/USD: The technical picture
On the weekly chart, BTC/USD has been moving in a tight range with bearish bias since the end of July. The first digital asset made several attempts to settle above a critical resistance of $12,000, however, none of them were successful. Moreover, the recent move to a new high of 2020 triggered massive profit-taking on speculative positions and resulted in a sharp sell-off. Thus this barrier proved to be a hard nut to crack for the bulls; however, once it is out of the way, the upside momentum may quickly gain traction. A weekly close above this area will improve the technical picture and bring $13,000 in focus.
BTC/USD weekly chart
-637342149318386058.png)
On the downside, $11,300-$11,000 constitutes a strong support area that has the potential to limit the sell-off attempts. Once it is out of the way, the bearish momentum is likely to gain traction with the next focus on $10,800 reinforced by the daily SMA50. It is closely followed by $10,500 that served as a formidable resistance and limited recovery since the end of 2019. A sustainable move above this area will worsen the technical picture and attract new sellers to the market. The next bearish target of $10,000 (daily SMA100) will be reached very quickly.
Notably, the RSI on the weekly chart has started to reverse to the downside from an overbought territory, which means the longer-term risks are tilted to the downside and we will need a convincing bullish trigger to change the technical picture.
BTC/USD daily chart
-637342149623123154.png)
The daily chart implies that the price may continue moving inside the range limited by $11,800-$12,000 on the upside and $11,300-$11,000 on the downside. The borders of the channel are reinforced by the lines of the daily Bollinger Band, while the RSI on the daily chart signals that the price may retest its upper boundary before reversing back.
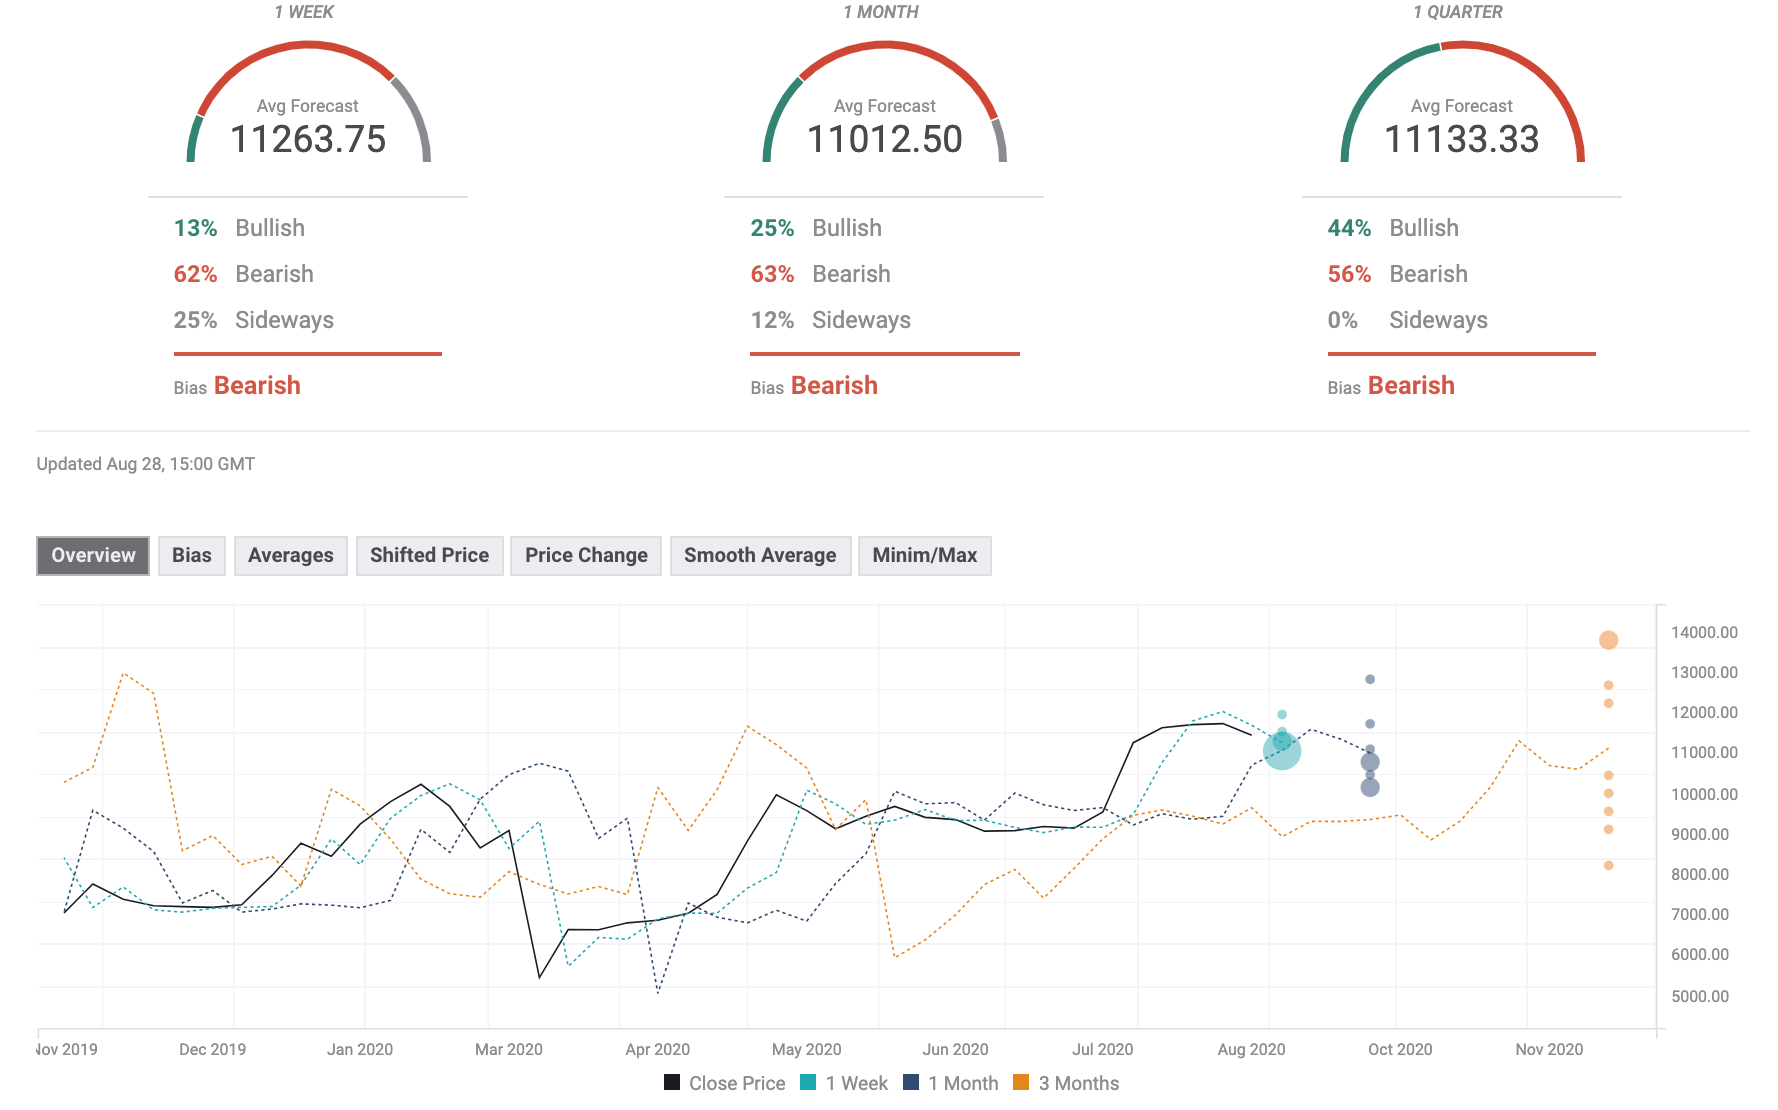
The Forecast Poll has worsened since the previous week as expectations on all timeframes are bearish now. Now the experts believe that the risks are tilted to the downside both in the short run and in the long period. Notably, price forecasts are also below $12,000. It means does not expect that Bitcoin rises significantly and bet on the continuation of a sidelined trading in a channel.
Author

Tanya Abrosimova
Independent Analyst


