Bitcoin vs S&P 500: Why bullish US jobless claims could drive BTC price to $90K
- Bitcoin price stabilizes above $84,500 on Friday, with bulls avoiding a sub-80K breakdown this week.
- US Jobless Claims came in below expectations last week.
- Divergence between Bitcoin and S&P 500 suggests investors are increasingly favoring BTC since Trump confirmed new tariffs on April 2.

Bitcoin price stabilizes above $84,500 on Friday, despite US tech stock sell-offs. Can BTC advance towards $90,000 as investors digest strong US labor data and Trump's calls for rate cuts.
Bitcoin vs S&P 500: Why bullish US Jobless Claims could drive BTC price to $90K
Bitcoin (BTC) price stabilized above $84,500 on Friday, defying volatility pressures and sustaining its bullish posture after a tense trading week.
Fresh data from the US Bureau of Labor Statistics showed Jobless Claims in the last week came in 4% below forecasts, pointing to stronger-than-expected labor market conditions despite tariff pressures.
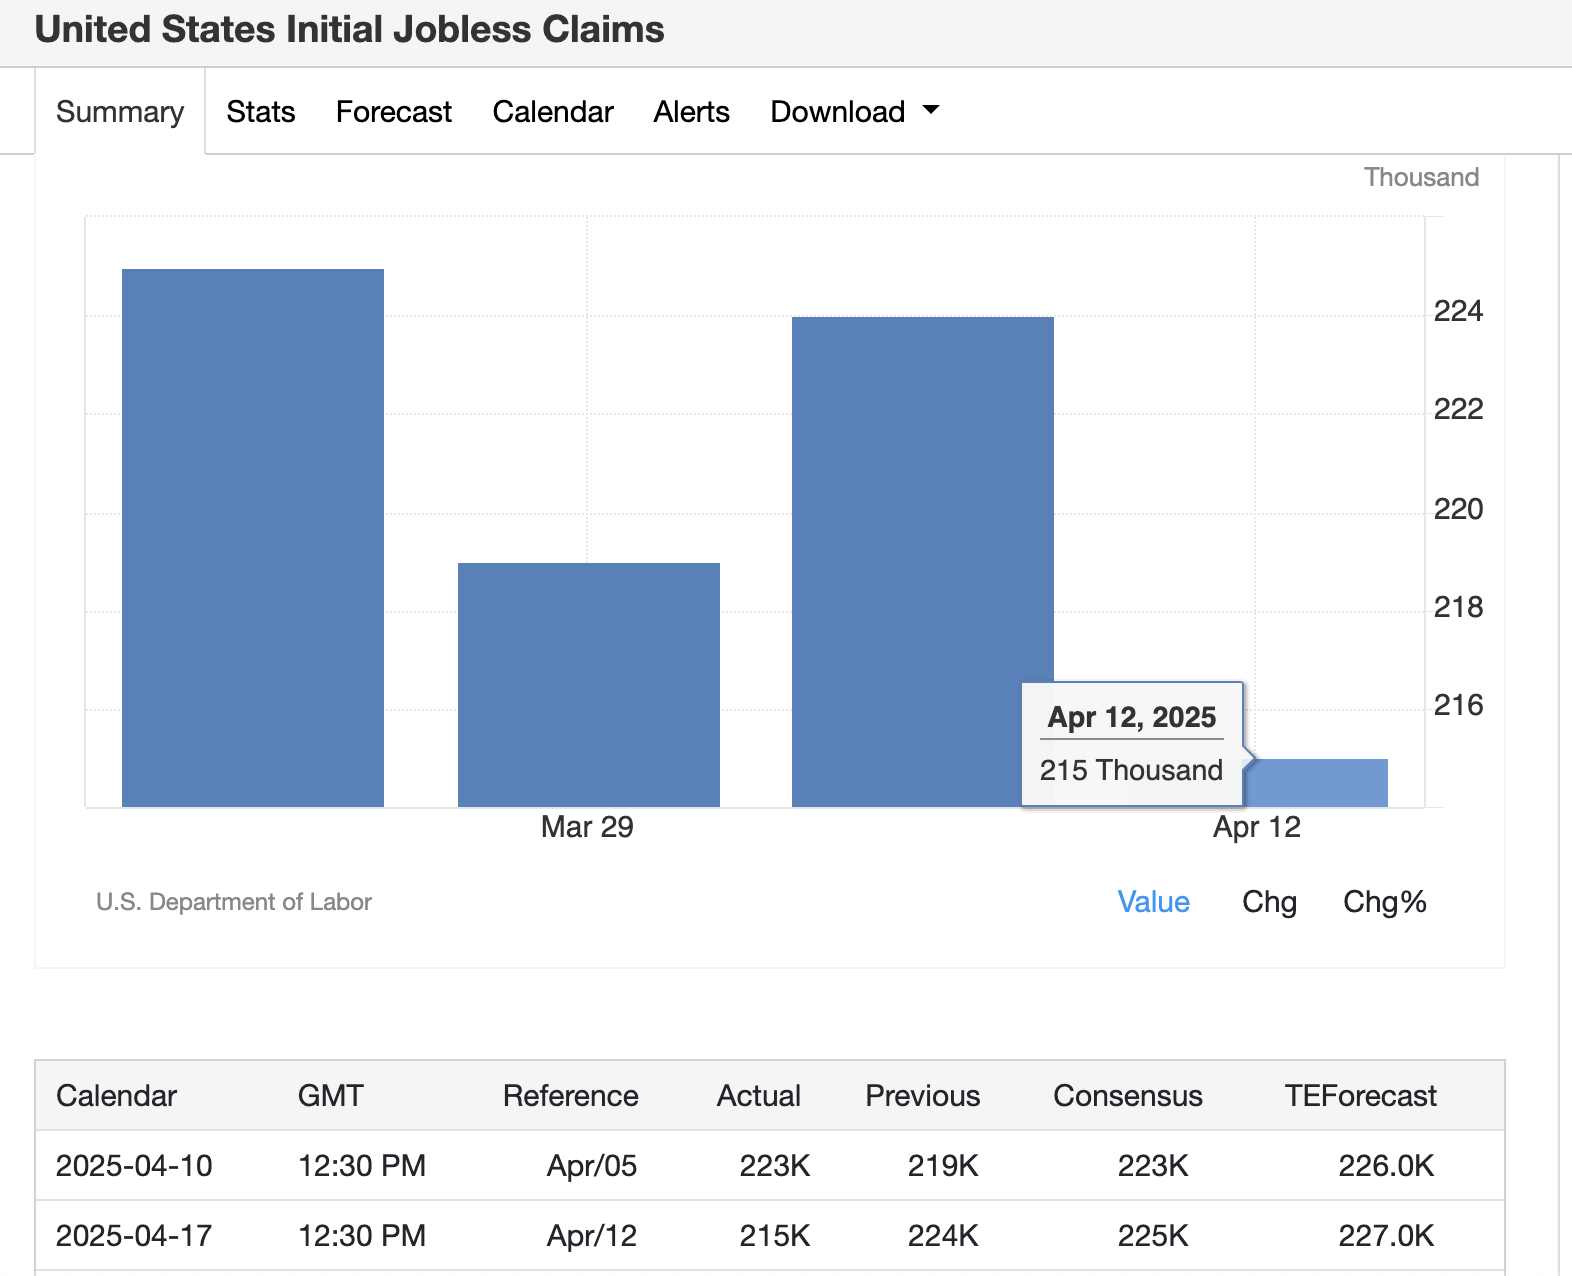
US Jobless Claims | April 2025 | Source: TradingEconomics
As seen in the chart above, Jobless Claims for the week ending April 12 came in at 215,000, 4% lower than the consensus forecast, and 9,000 fewer claims than the previous count of 224,000.
The strong US labor market data has stoked investor appetite for risk-on assets, coinciding with dovish monetary policy calls from US President Donald Trump.
On Thursday, President Trump criticized Federal Reserve (Fed) Chair Jerome Powell, calling for rate cuts to match the European Central Bank’s (ECB) more aggressive easing path.
Paired with the resilient job market, this could pressure the Fed to act after consecutive pauses at the last two Federal Open Market Committee (FOMC) meetings in Q1 2025.
While a strong labor market is generally viewed as hawkish, Trump’s comment positions it as proof that the economy can absorb rate cuts amid high tariffs without heating up recession risks.
Bitcoin vs S&P 500 divergence shows investors’ preference for BTC since Liberation Day tariffs
Since Trump’s April 2 announcement of new tariffs on “Liberation Day,” Bitcoin has widened its performance gap over the S&P 500.
The divergence trends signal shifting investor sentiment, as capital increasingly flows into BTC while traditional equities face pressure. Nvidia, in particular, took a $5.5 billion tariff-linked charge, sparking major sell-offs across top US tech stocks this week.
Santiment’s Bitcoin vs S&P 500 divergence chart below tracks the directional performance trend between BTC price and top US stocks.
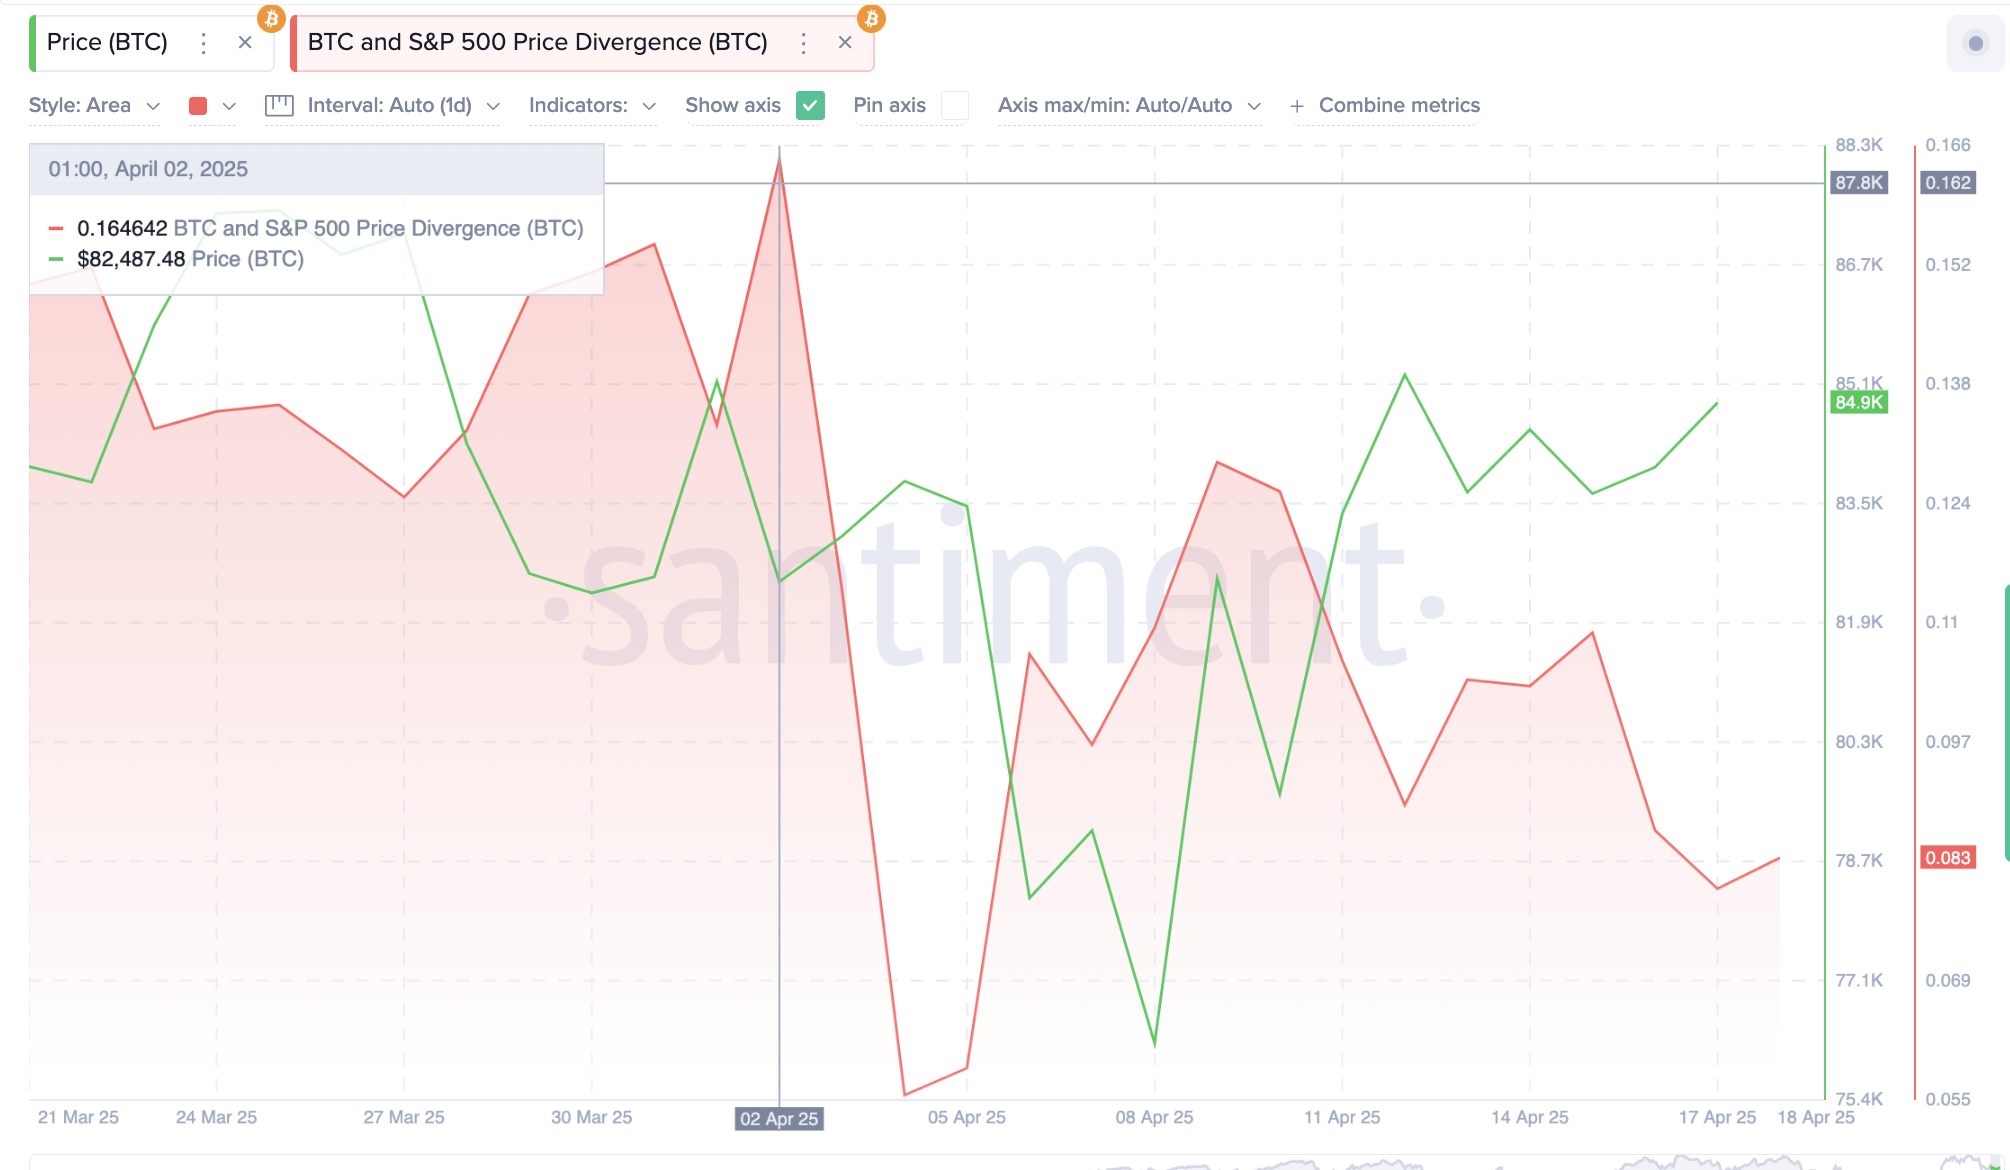
Bitcoin price vs. S&P 500 divergence, April 2025 | Source: Santiment
As seen above, the BTC and S&P 500 divergence coefficient dropped from 0.16% on April 2 to 0.083% at press time on Friday.
This means the correlation gap between Bitcoin and the S&P 500 has nearly halved, signaling a 48.1% stronger BTC performance over equities in just over two weeks.
This shows growing preference among investors to rotate capital into Bitcoin amid mounting macro and trade policy risks for US stocks.
Bitcoin’s stability around $85,000 since Nvidia’s 7% haircut on Tuesday further emphasizes that BTC has emerged as a preferred hedge, since the US trade war ticked off, with Trump’s sweeping tariff announcement on April 2.
Within this context, if the lower-than-expected US Jobless claims data pressures the Fed to cut rates as Trump directed earlier this week, BTC price could push toward the $90,000 mark.
As Santiment’s BTC vs S&P 500 data trend emphasizes growing investor preference for Bitcoin over top US stocks, US Jobless Claims reactions could further widen that gap.
Bitcoin price forecast today: BTC targets $87,000 amid upside pressure from US Jobless Claims
Bitcoin price forecast today leans bullish after BTC stabilized above $84,000, with a firm intraday range and diminishing downside momentum. The chart shows Bitcoin closing at $84,532 while maintaining proximity to the Chande Kroll Stop resistance at $84,111, suggesting ongoing attempts to mount a key support cluster around this zone.
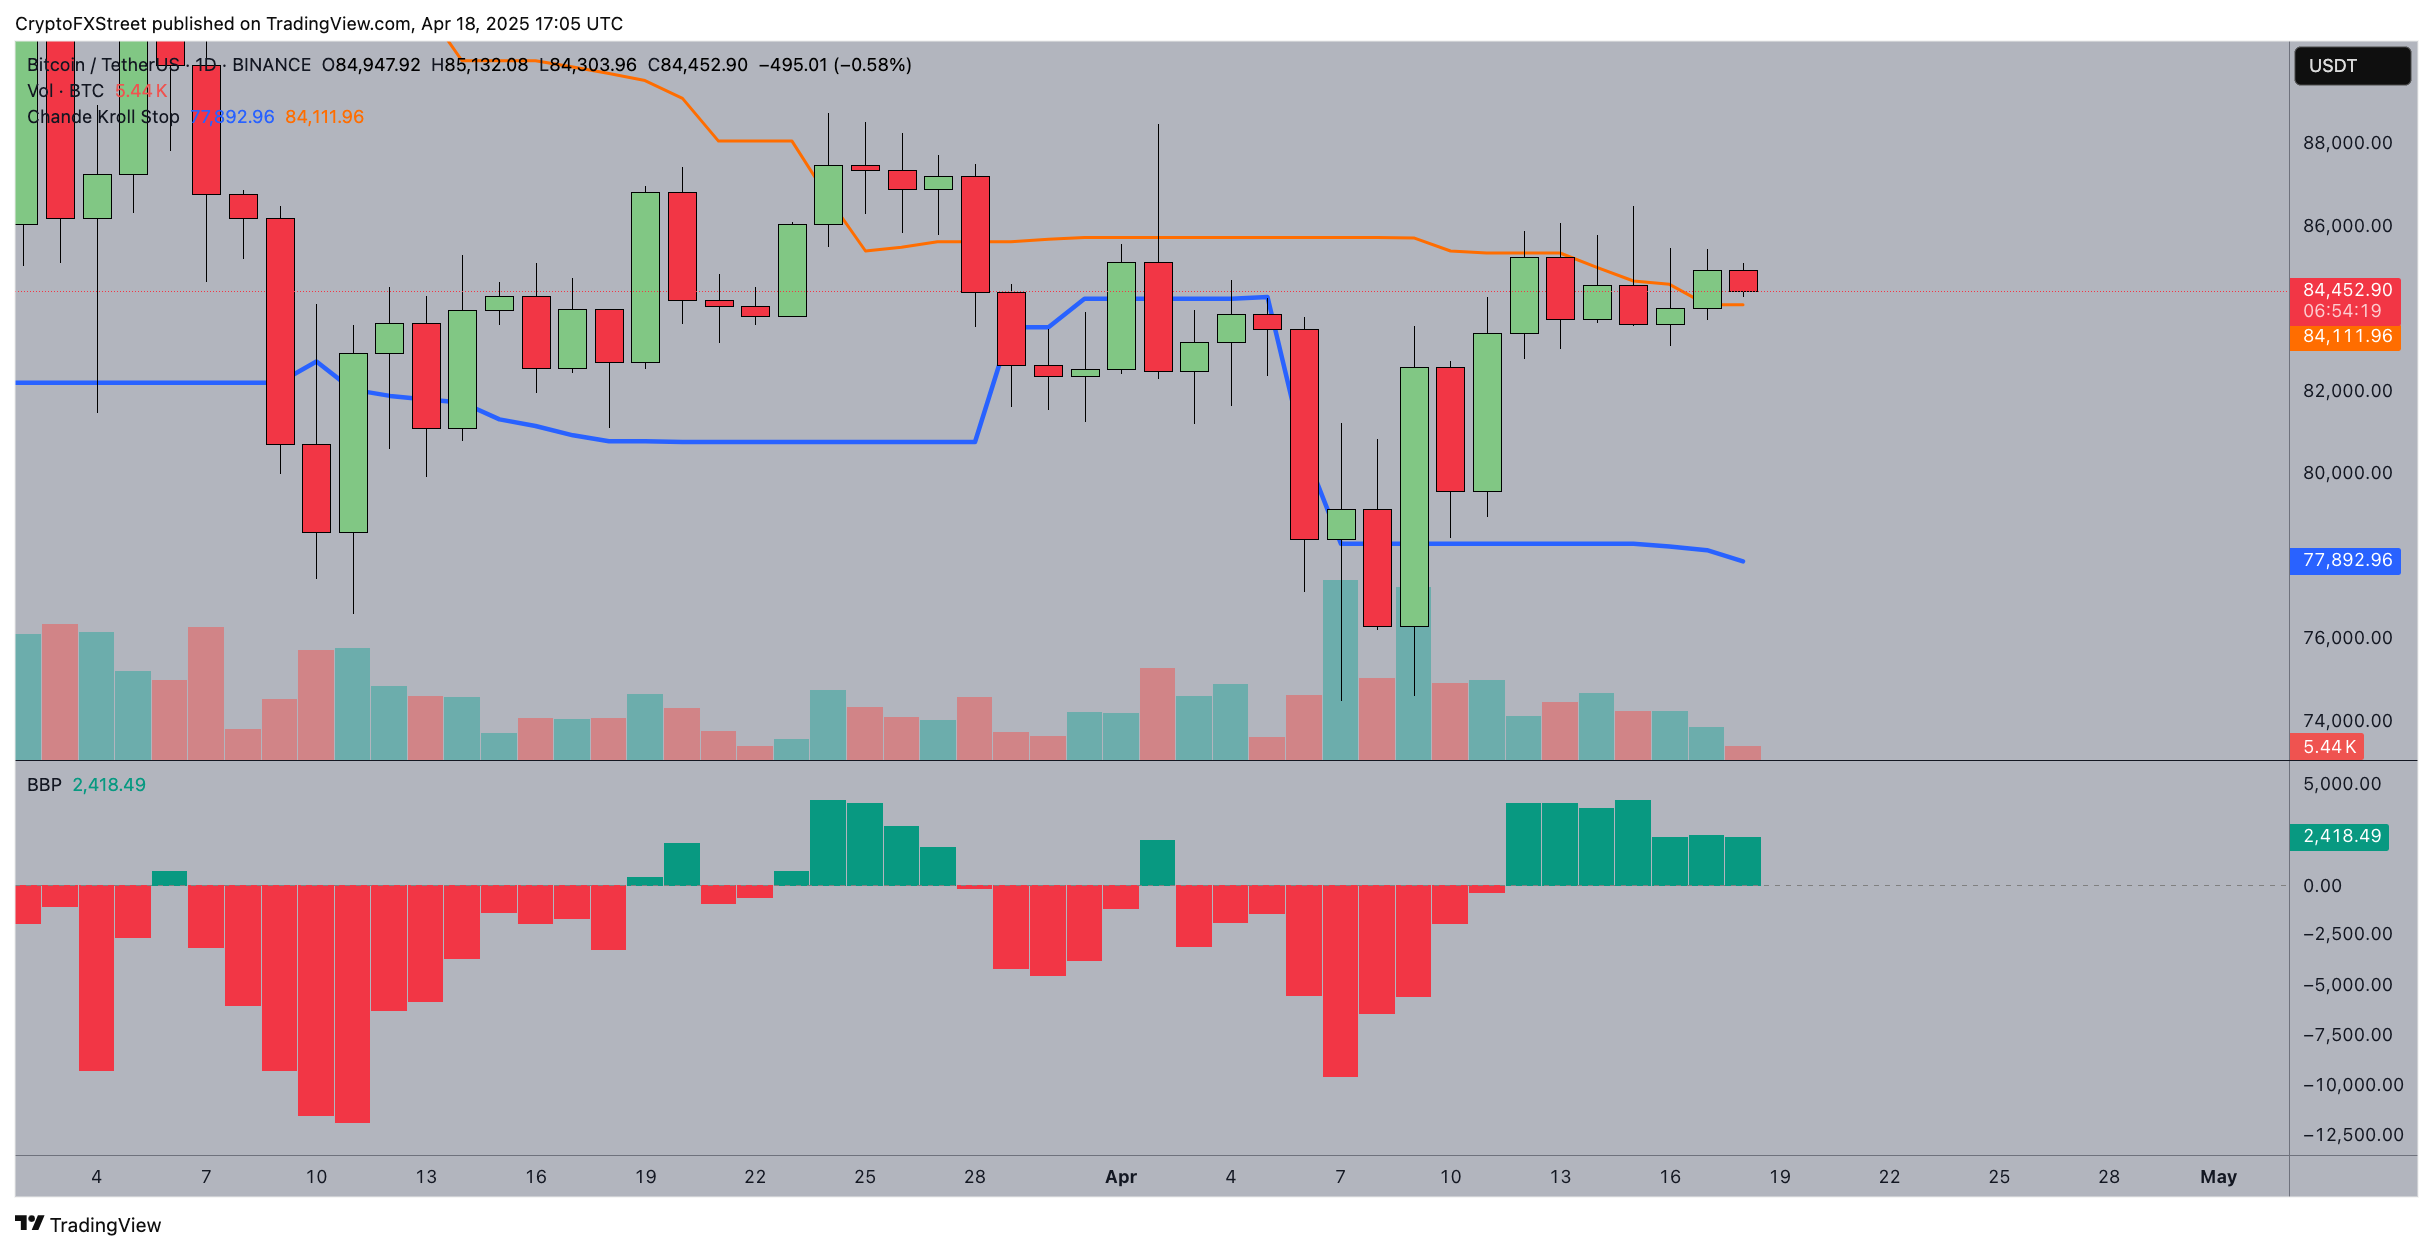
Bitcoin price forecast today
More so, the BBP (Balance of Power) indicator has flipped green and currently reads 2,395.85, reflecting a clear transition from negative to positive momentum. This uptick indicates that buying power is once again overtaking selling pressure.
Should BTC clear the $84,900 resistance formed by recent highs, a push toward $87,000 becomes technically viable.
However, on the bearish side, a breakdown below the $84,100 Chande Kroll Stop would expose BTC to a retest of the $77,892 support line. As long as the BBP stays above zero, upside remains more probable.
Author

Ibrahim Ajibade
FXStreet
Ibrahim Ajibade is an accomplished Crypto markets Reporter who began his career in commercial banking. He holds a BSc, Economics, from University of Ibadan.


