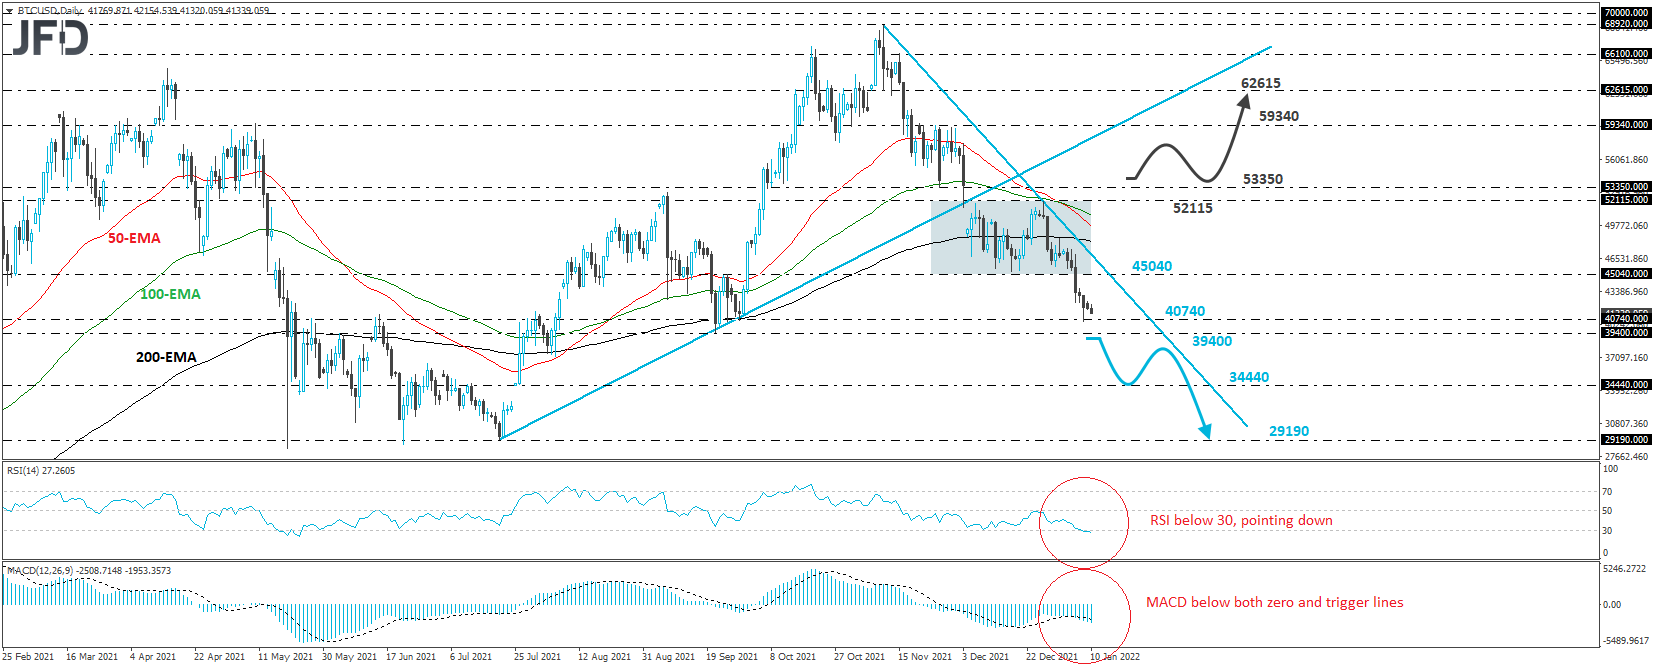
Bitcoin tumbles near the 40740 barrier

BTC/USD has been trading in a sliding mode since December 27th, when it hit resistance at the 52115 level. That said, in our view, the important technical slide was the break below 45040 on January 5th. This confirmed a forthcoming lower low, and the exit of the consolidation range the crypto had been trading within since December 5th. Then the crypto was paused near the 40740 level, marked by the low of September 29th, but bearing in mind that it is trading below the prior upside support line taken from the low of July 20th, as well as below the downside line taken from the high of November 11th, we would see decent chances for further declines.
However, in order to get more confident on that front, we would like to see a clear dip below the 39400 hurdle, which is marked by the low of September 21st. This could encourage the bears to push towards the low of July 25th, at 34440, and if they are not willing to stop there, a break lower could see scope for extensions towards the 29190 area, which acted as a temporary floor between May 19th and July 20th.
Shifting attention to our daily oscillators, we see that the RSI fell below 30 and continued to point down, while the MACD lies below both its zero and trigger lines. Both indicators detect strong downside speed and support the notion for further declines in this cryptocurrency, at least in the near term.
In order to abandon the bearish case, and start examining whether the bulls may have gained the upper hand, we would like to see a clear break above 53350. The price would still bel below the upside line taken from the low of July 20th, but the recovery would have also confirmed a forthcoming higher high on the daily chart. We would then expect advances towards the 59340 territory, which provided resistance between November 21st and December 1st, where another break could allow extensions towards the 62615 barrier, marked by the inside swing low of November 10th.
Author

JFD Team
JFD


