Bitcoin Technical Analysis: BTC/USD the range that has plagued price action continues
- Bitcoin price on Friday trading down over 1% in the second half of the day.
- BTC/USD remains very much plagued by mundane daily price range.

BTC/USD 15-minute chart
- Buyers continue to protect the big near-term support area of $3500.
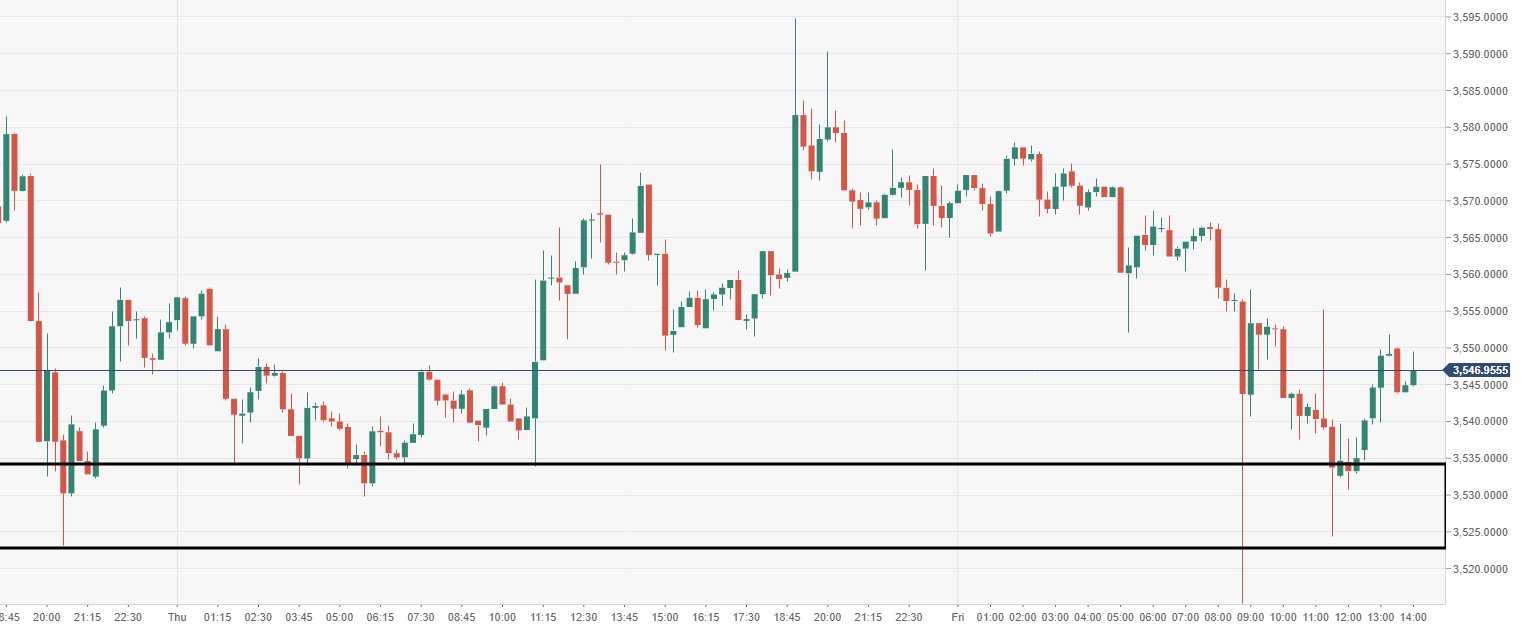
Spot rate: 3545.52
Relative change: -1.30%
High: 3577.89
Low: 3515.32
Trend: Bearish
Support 1: 3534.7, daily pivot point support.
Support 2: 3499.7, daily pivot point support.
Support 3: 3469.72, daily pivot point support.
Resistance 1: 3599.69, daily pivot point resistance.
Resistance 2: 3629.7, daily pivot point resistance.
Resistance 3: 3664.67, daily pivot point resistance.
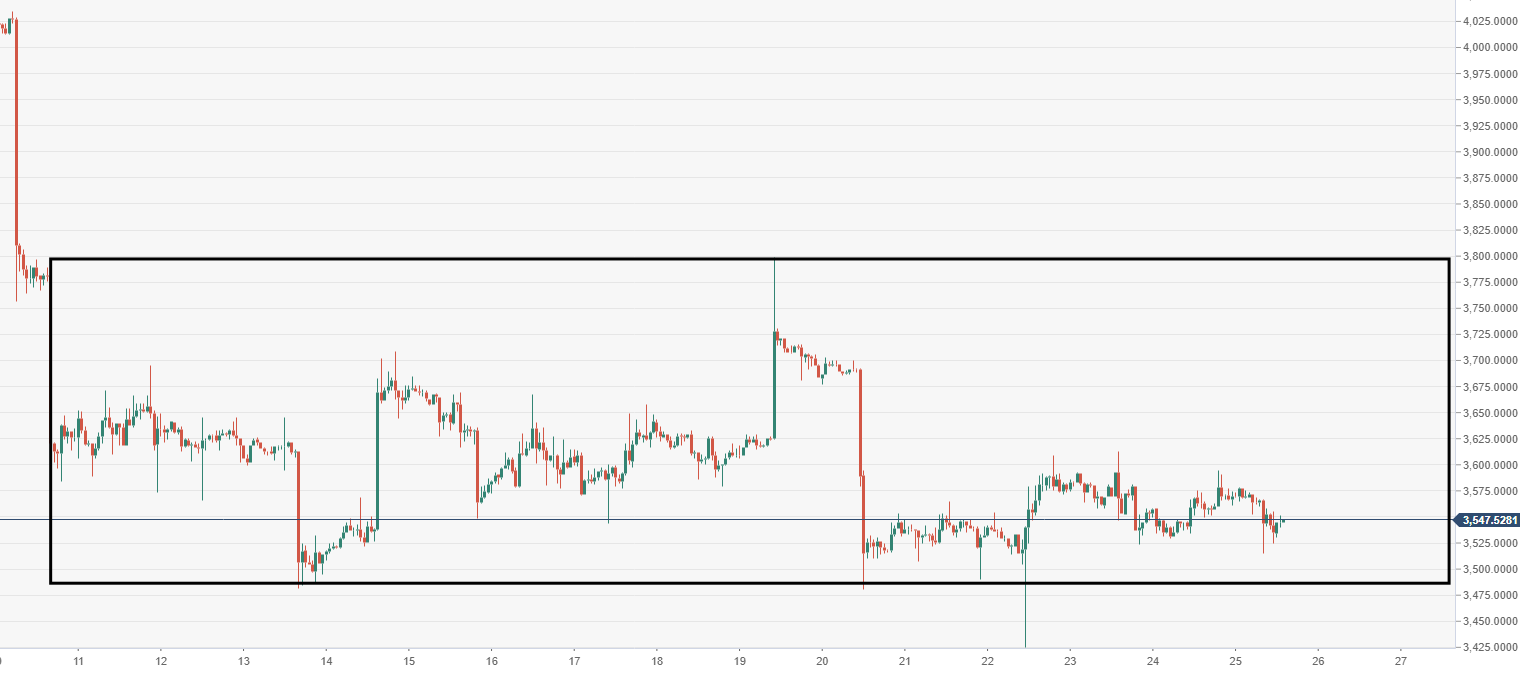
BTC/USD 60-minute chart
- Price continues to bounce within the range-block formation, as seen via the 60-minute.
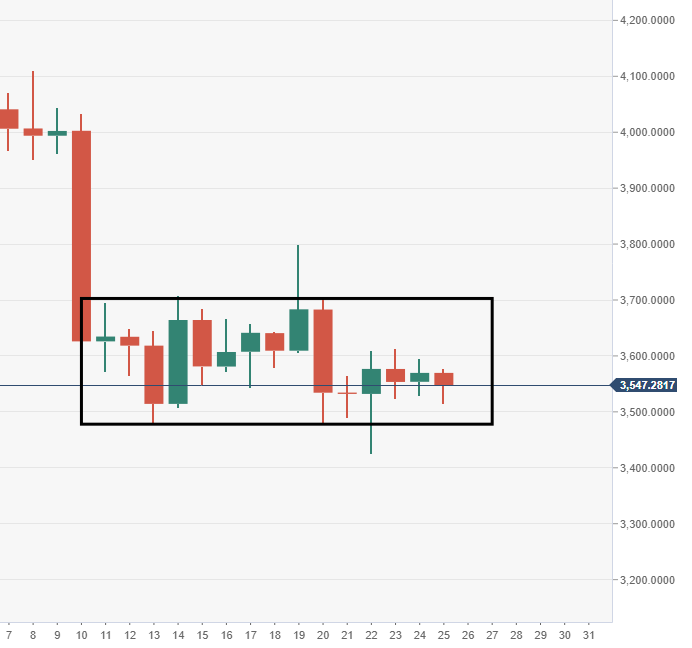
BTC/USD daily chart
- Bitcoin remains stuck within the confinements of narrow daily range, since 11th January.
Author

Ken Chigbo
Independent Analyst
Ken has over 8 years exposure to the financial markets. He started his career as an analyst, covering a variety of asset classes; forex, fixed income, commodities and equities.


