Bitcoin technical analysis: BTC/USD large vulnerabilities with price trading under $10,000
- Bitcoin price in the session on Thursday is trading with losses of some 1.20%.
- BTC/USD buyers critically defended the $10,000 mark, after the large scare on Thursday.
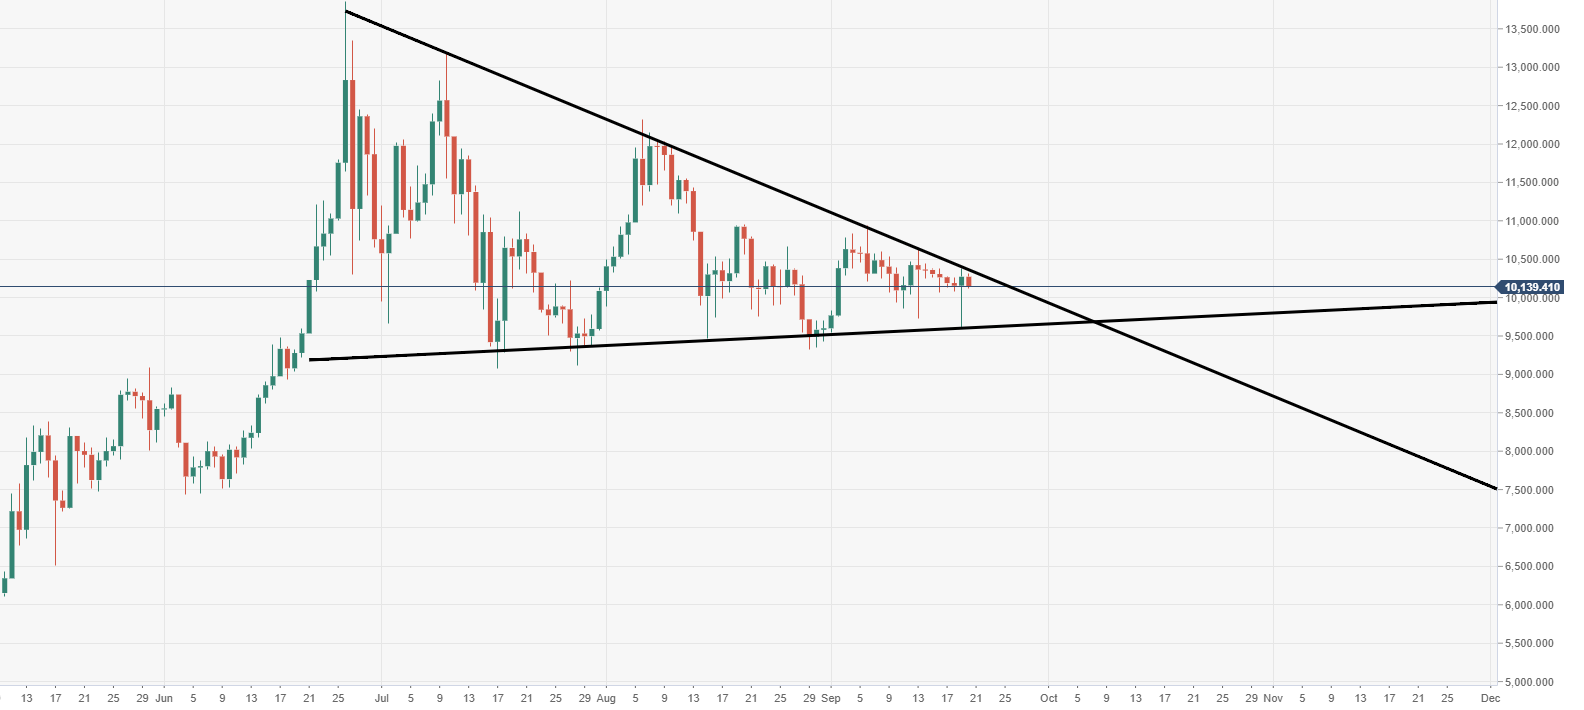
- The breakout of the long-running triangular structure is going to be very trend defining for the Bitcoin.

Spot rate: 10,138.19
Relative change: -1.30%
High: 10,309.18
Low: 10,123.90
BTC/USD daily chart
- BTC/USD is flirting with a critical ascending trend line, which makes up the long-serving narrowing triangular structure, which has been containing the price.
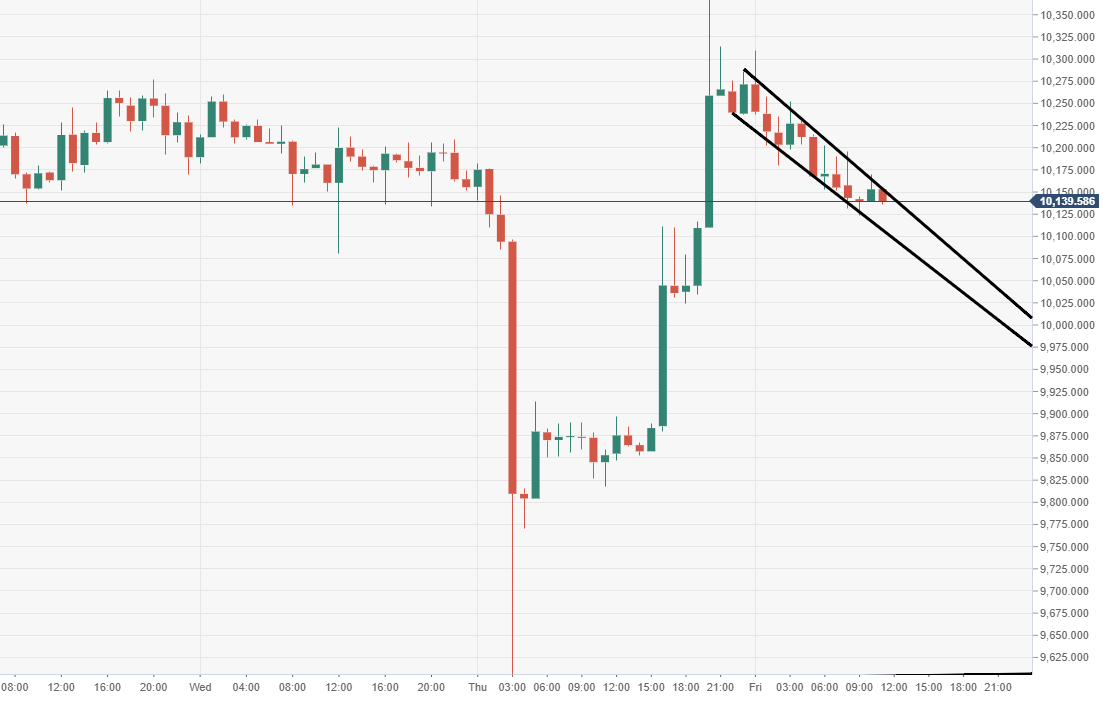
BTC/USD 60-minute chart
- Near-term price action via the 60-minute has formed a bullish flag, subject to breakout.
Author

Ken Chigbo
Independent Analyst
Ken has over 8 years exposure to the financial markets. He started his career as an analyst, covering a variety of asset classes; forex, fixed income, commodities and equities.
More from Ken Chigbo


