Bitcoin technical analysis: BTC/USD fresh selling pressure as price firmly smashes $9000
- Bitcoin price is trading in negative territory, down some 4% in the second half of the session.
- Near-term price action has smashed out from a bearish flag structure.
- BTC/USD is subject to further downside pressure should critical support of $900 be given up.

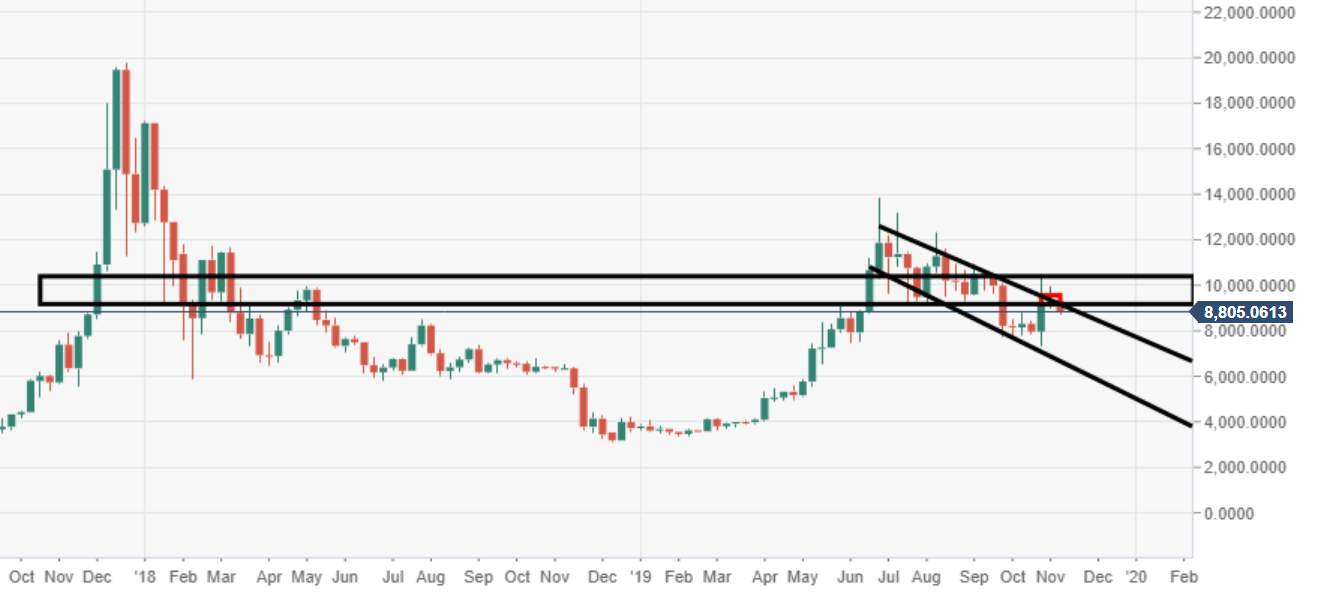
BTC/USD weekly chart
The price is testing critical weekly support to the downside seen at the $9000 price mark, which the bears are at present in control of driving deeper below.
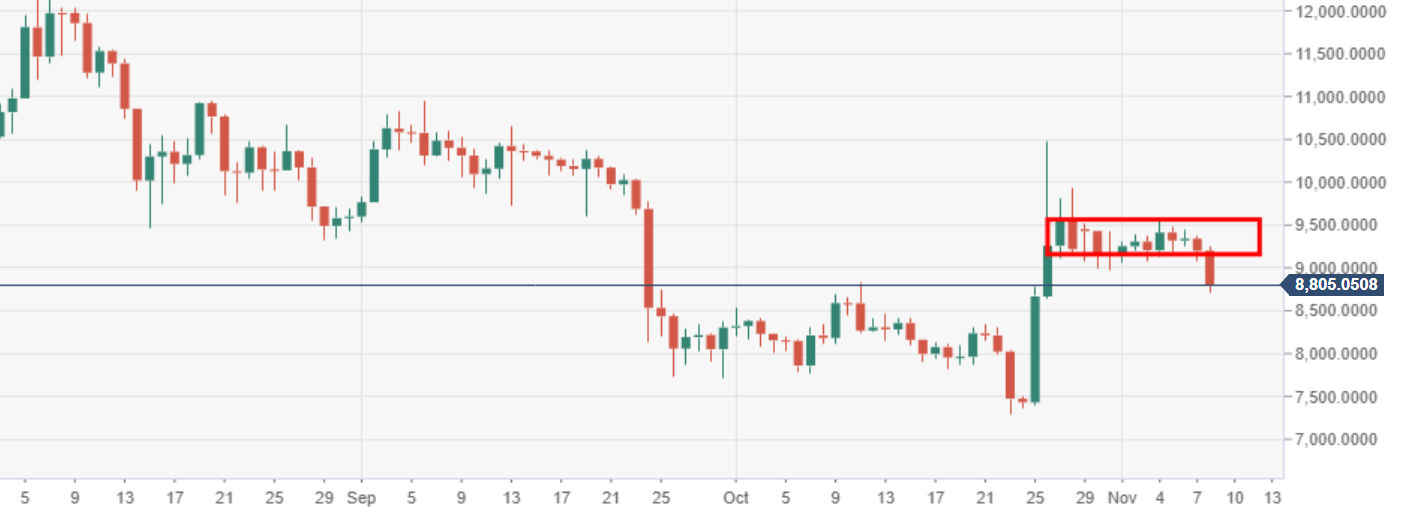
BTC/USD daily chart
Daily price action is lost much upside momentum, following failure to break down supply at $9500.
BTC/USD 15-minute chart
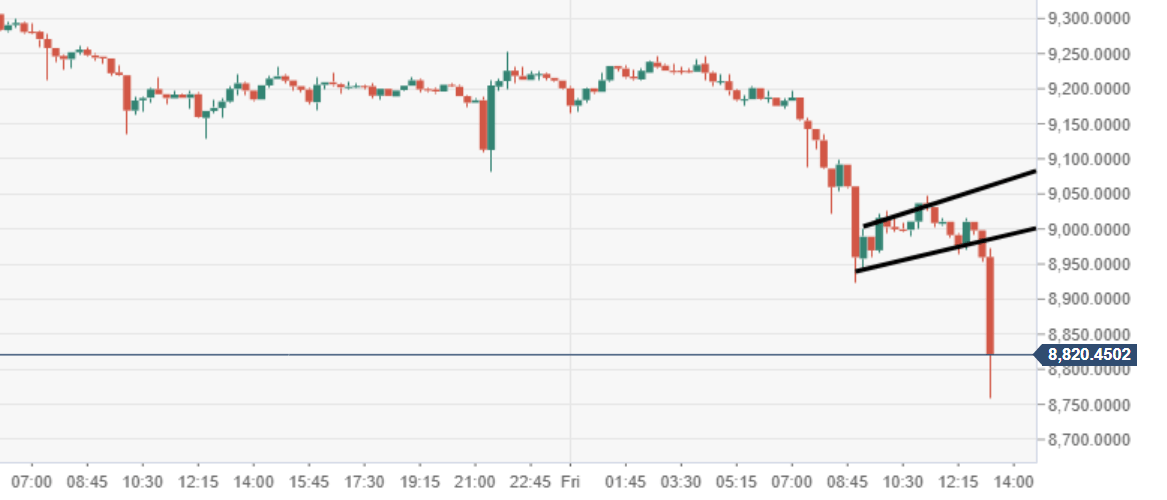
Spot rate: 8,993.28
Relative change: -2.25%
High: 9,247.27
Low: 8714.48
Author

Ken Chigbo
Independent Analyst
Ken has over 8 years exposure to the financial markets. He started his career as an analyst, covering a variety of asset classes; forex, fixed income, commodities and equities.
More from Ken Chigbo


