Bitcoin technical analysis: BTC/USD edging out of a bullish flag structure
- Bitcoin price is trading in positive territory, up some 2.60% in the second half of the session.
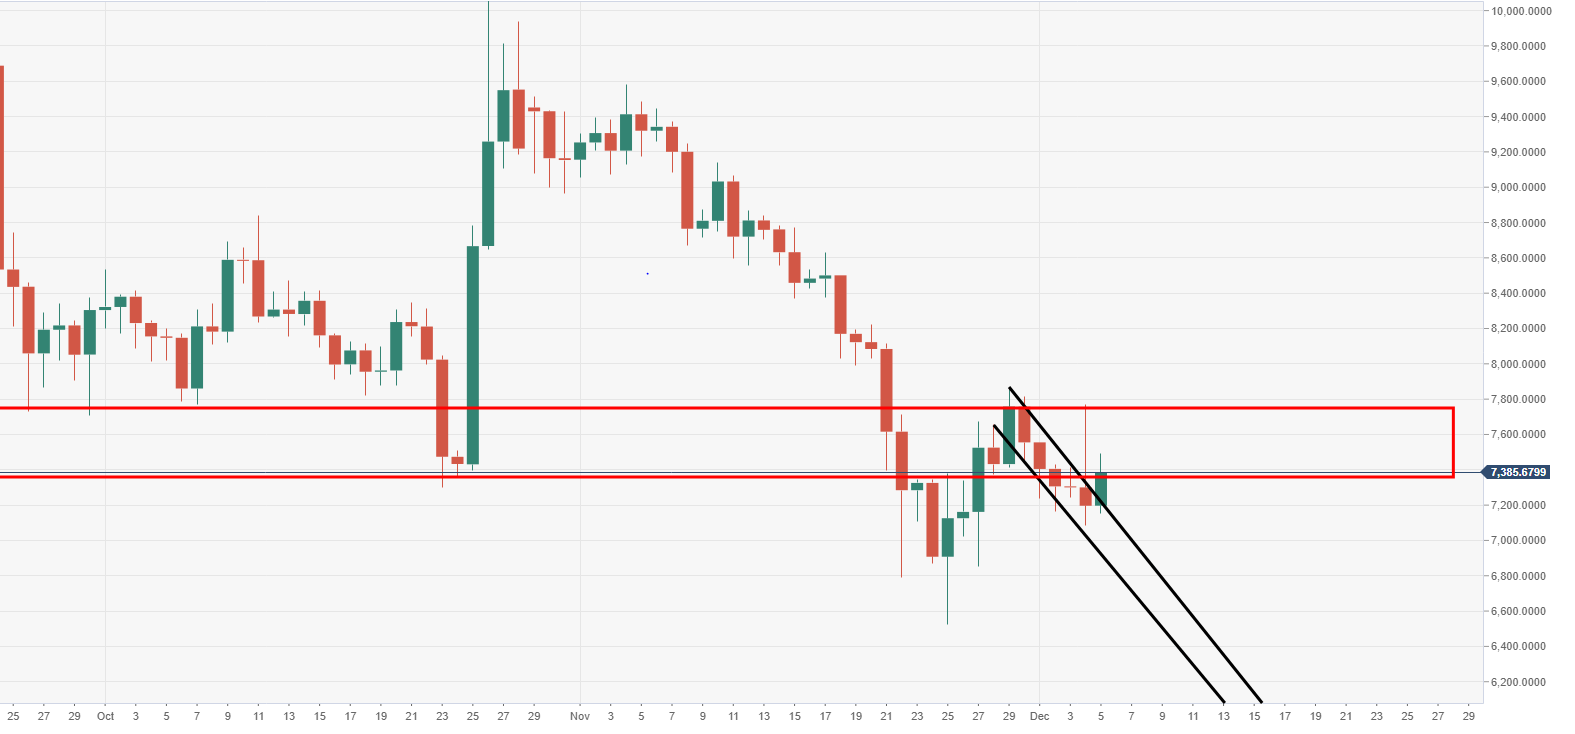
- BTC/USD price action has broken out from a bullish flag structure via the daily view.
- There is a chunky barrier of resistance seen from $7500-800 price range.

BTC/USD daily chart
The price has been running at five-consecutive sessions in the red, bulls are looking to snap this current losing streak.
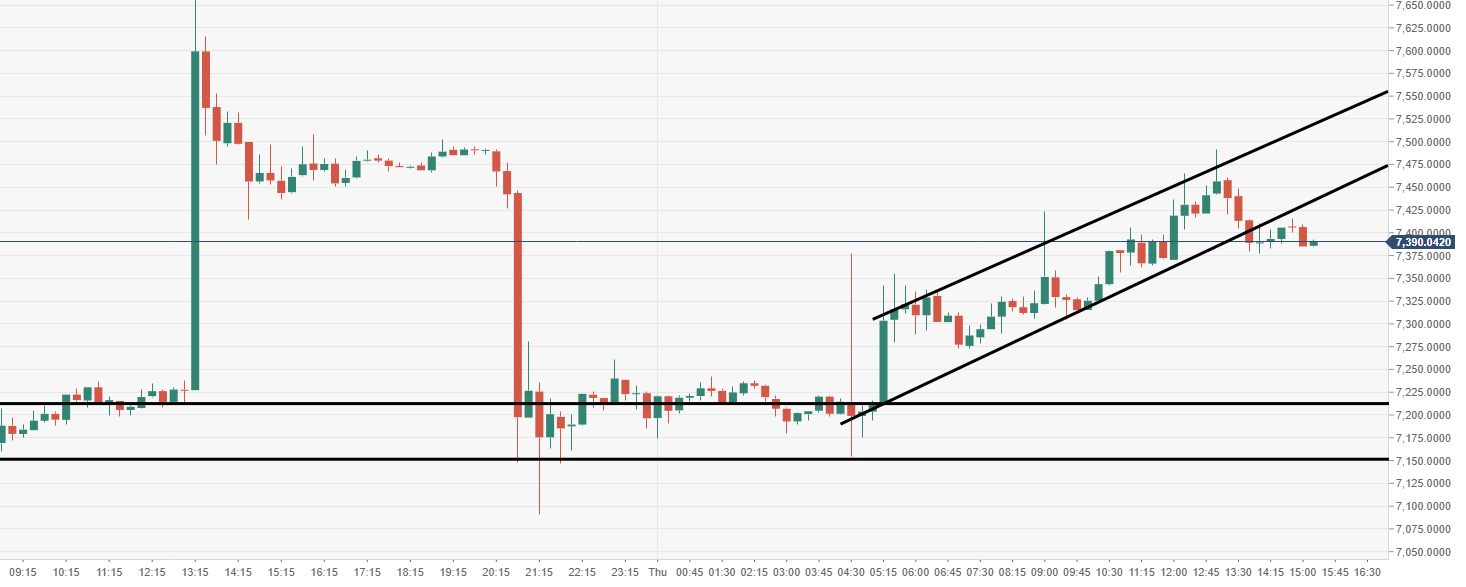
BTC/USD 15-minute chart
Near-term price action has breached an ascending channel structure, support eyed down at $7200-7150 range.
Spot rate: 7388.78
Relative change: +2.70%
High: 7491.98
Low: 7154.87
Author

Ken Chigbo
Independent Analyst
Ken has over 8 years exposure to the financial markets. He started his career as an analyst, covering a variety of asset classes; forex, fixed income, commodities and equities.
More from Ken Chigbo


