Bitcoin Technical Analysis: BTC/USD bullish flag subject to breakout
- Bitcoin price is trading down in very minor positive just some 0.10% in the second half of the session on Friday.
- BTC/USD price action has formed a bullish flag pattern seen via the 4-hour chart, subject to a breakout.

BTC/USD 15-minute chart
- Chunky sellers pilled into BTC/USD in the $3600 price region, a known near-term supply area.
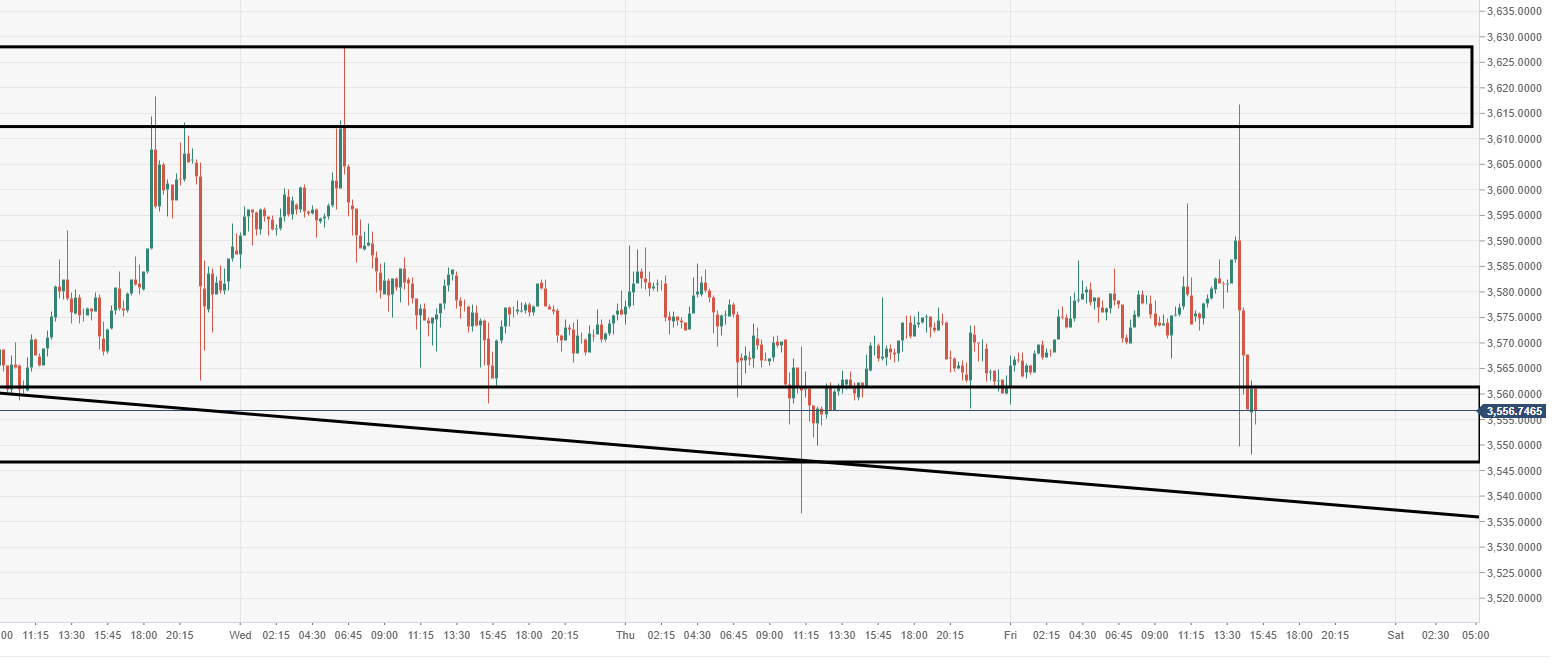
Spot rate: 3556.45
Relative change: +0.10%
High: 3616.82
Low: 3548.05
Trend: Neutral
Support 1: 3535.68, daily pivot point support.
Support 2: 3509.95, daily pivot point support.
Support 3: 3483.21, daily pivot point support.
Resistance 1: 3588.15, daily pivot point resistance.
Resistance 2: 3614.88, daily pivot point resistance.
Resistance 3: 3640.62, daily pivot point resistance.
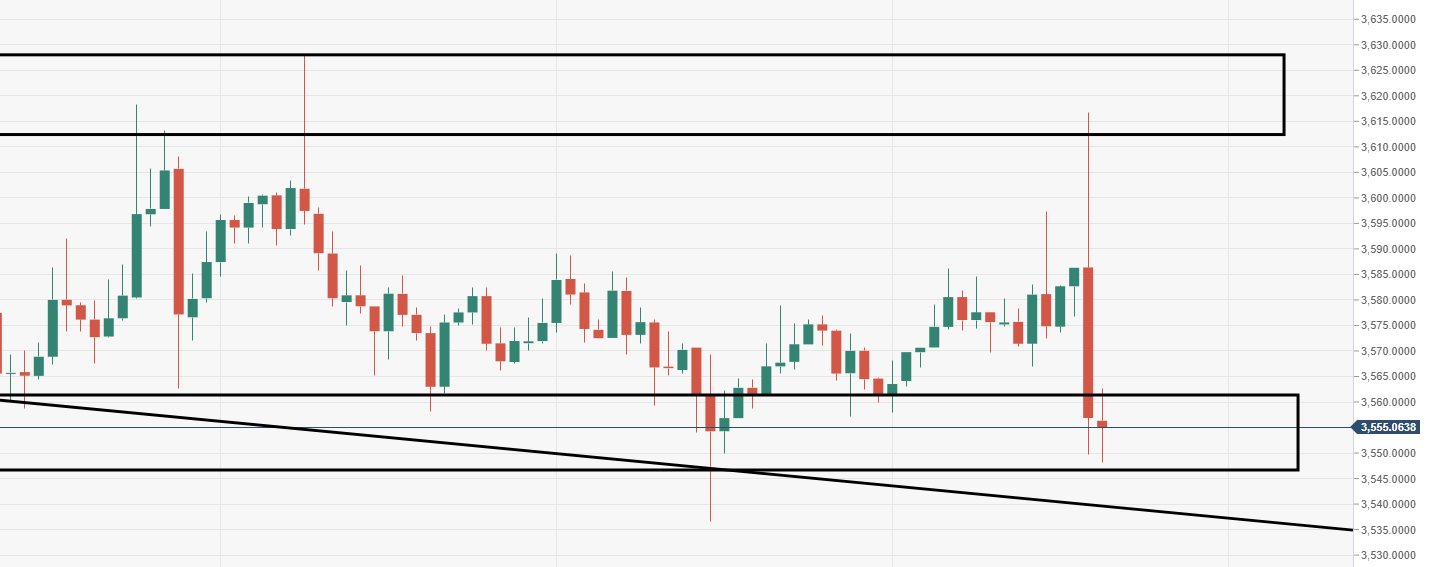
BTC/USD 60-minute chart
- Price remains propped up thanks to decent near-term demand zone within the $3500 region.
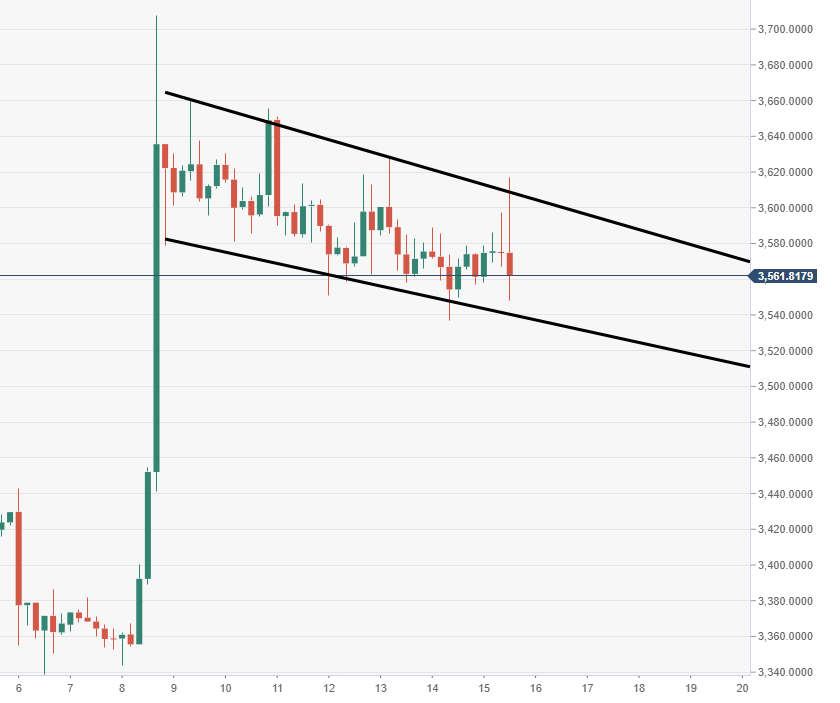
BTC/USD 4-hour chart
- Price action has formed a bullish flag pattern, subject to a breakout north.
Author

Ken Chigbo
Independent Analyst
Ken has over 8 years exposure to the financial markets. He started his career as an analyst, covering a variety of asset classes; forex, fixed income, commodities and equities.


