Bitcoin prints classic 'Bart' pattern as BTC price dives back below $40K

Bitcoin (BTC) reversed in classic fashion on March 10 after bulls failed once again to hold higher levels.
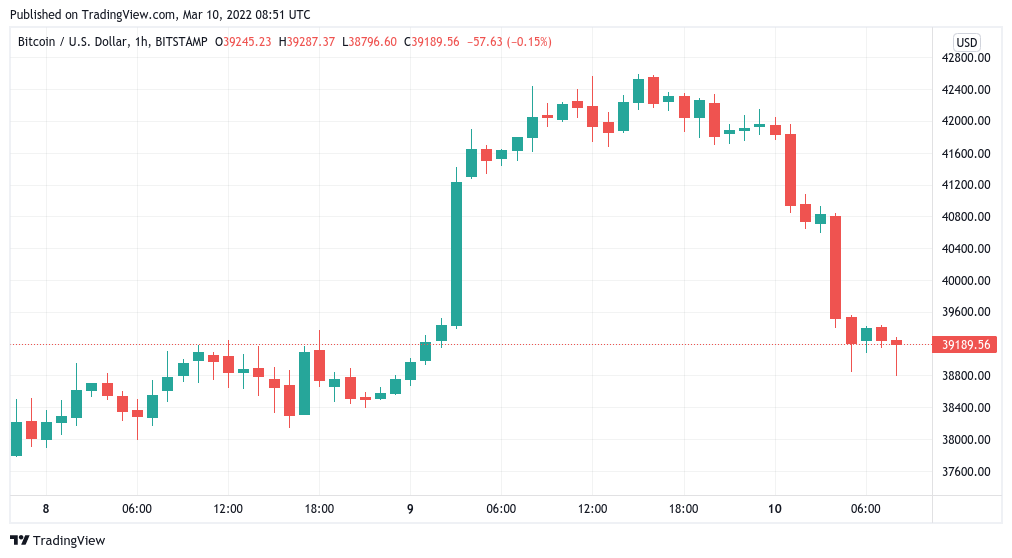
BTC/USD 1-hour candle chart (Bitstamp). Source: TradingView
Bart's back on the Bitcoin chart
Data from Cointelegraph Markets Pro and TradingView showed BTC/USD forming a characteristic “Bart Simpson” retracement pattern overnight on Wednesday.
The pair had managed to pass $42,000 before consolidating, but a lack of support meant that a drop back to its previous trading zone below $40,000 was the grimly familiar outcome.
Such “Bart” formations had come several times in the weeks prior and underscored the difficulty experienced by a market stuck firmly in an established trading range for months.
Those hoping for upside continuation were thus left disappointed, with cross-crypto liquidations for the 24 hours to the time of writing totaling $211 million, according to data from analytics resource Coinglass.
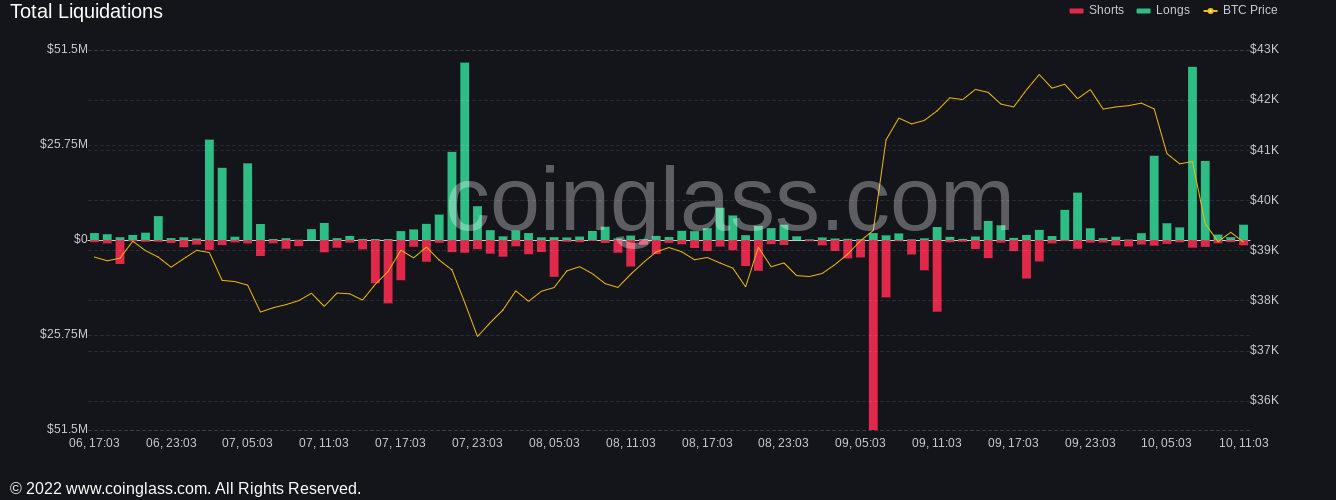
Crypto liquidations chart. Source: Coinglass
“Fried bulls this morning,” popular trader Crypto Ed, who had called the end of the upside at Wednesday’s highs, told Twitter followers.
“This is not PA but PP Ping Pong And yes, Asians always been good in Ping Pong,” he added, referring to both the up and down slopes of the “Bart” occurring during Asian market hours.
Thursday meanwhile would see the release of U.S. consumer price index (CPI) data for February, this tipped to show inflation still running hot at an estimated 7.9% year-on-year.
“CPI number comes out tomorrow & the FOMC meeting is in less than a week (March 15 & 16),” trader and analyst Matthew Hyland forecast in part of a tweet Wednesday.
“I expect volatility ahead, but increased certainty as a result.”
An accompanying chart underlined key resistance levels for BTC/USD to overcome, along with support at $36,300 and $33,000.
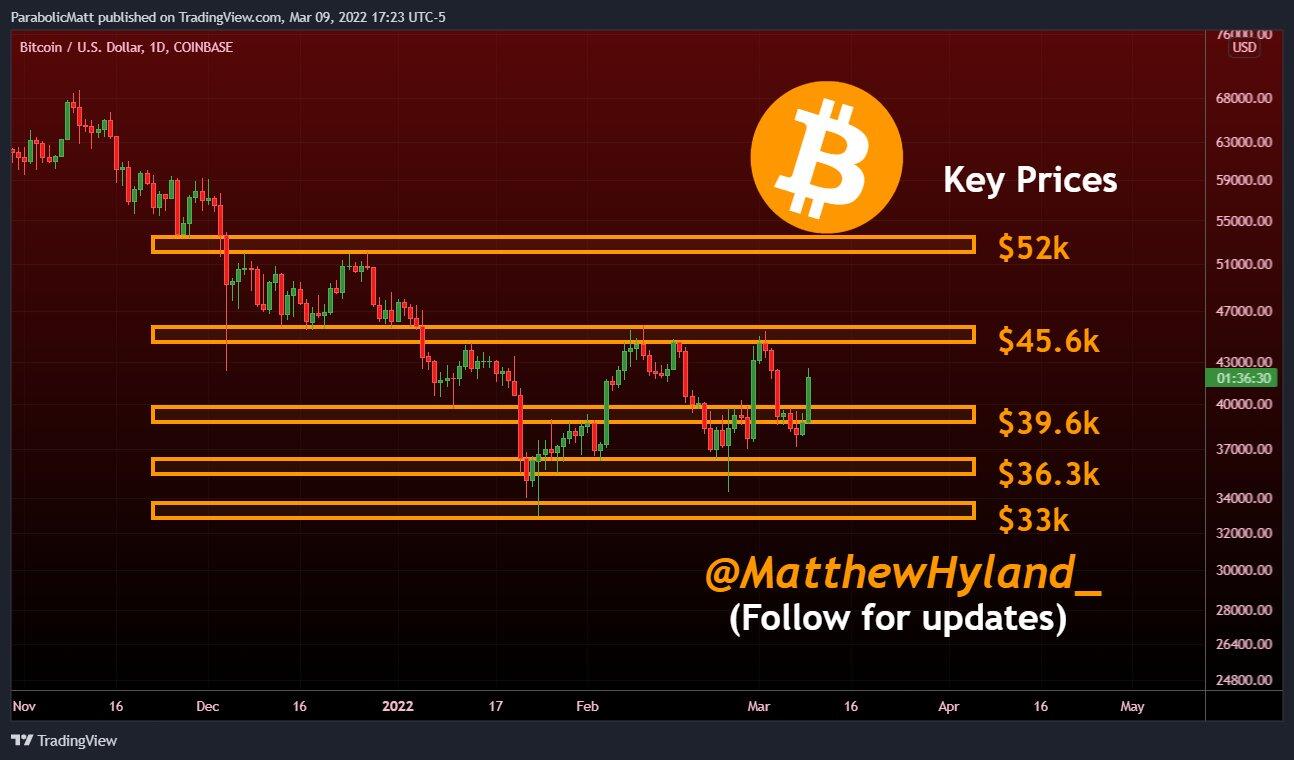
BTC/USD chart with key levels marked. Source: Matthew Hyland/ Twitter
Altcoins in copycat U-turn
Bitcoin’s volatility likewise cost altcoins much of their latest gains, with Ether (ETH) down 5.1% to less than $2,600.
Many others out of the top ten cryptocurrencies by market cap were equally gloomy on the day, with previous high flyer Terra (LUNA) nonetheless managing to linger near $100 highs.
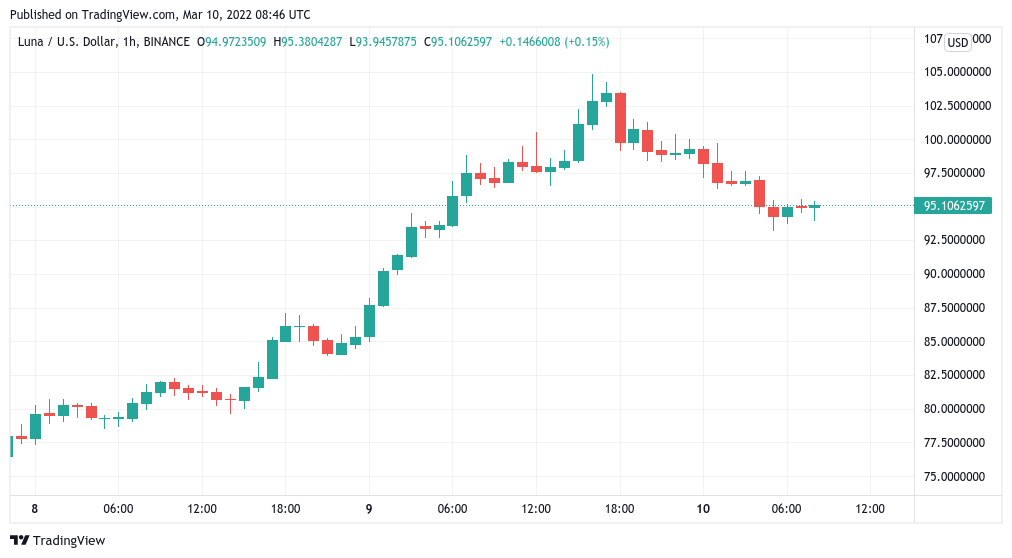
LUNA/USD 1-hour candle chart (Binance). Source: TradingView
Author

Cointelegraph Team
Cointelegraph
We are privileged enough to work with the best and brightest in Bitcoin.



