Bitcoin price trend remains unpredictable under $60,000
- Bitcoin price still unable to reclaim the psychologically important $60,000.
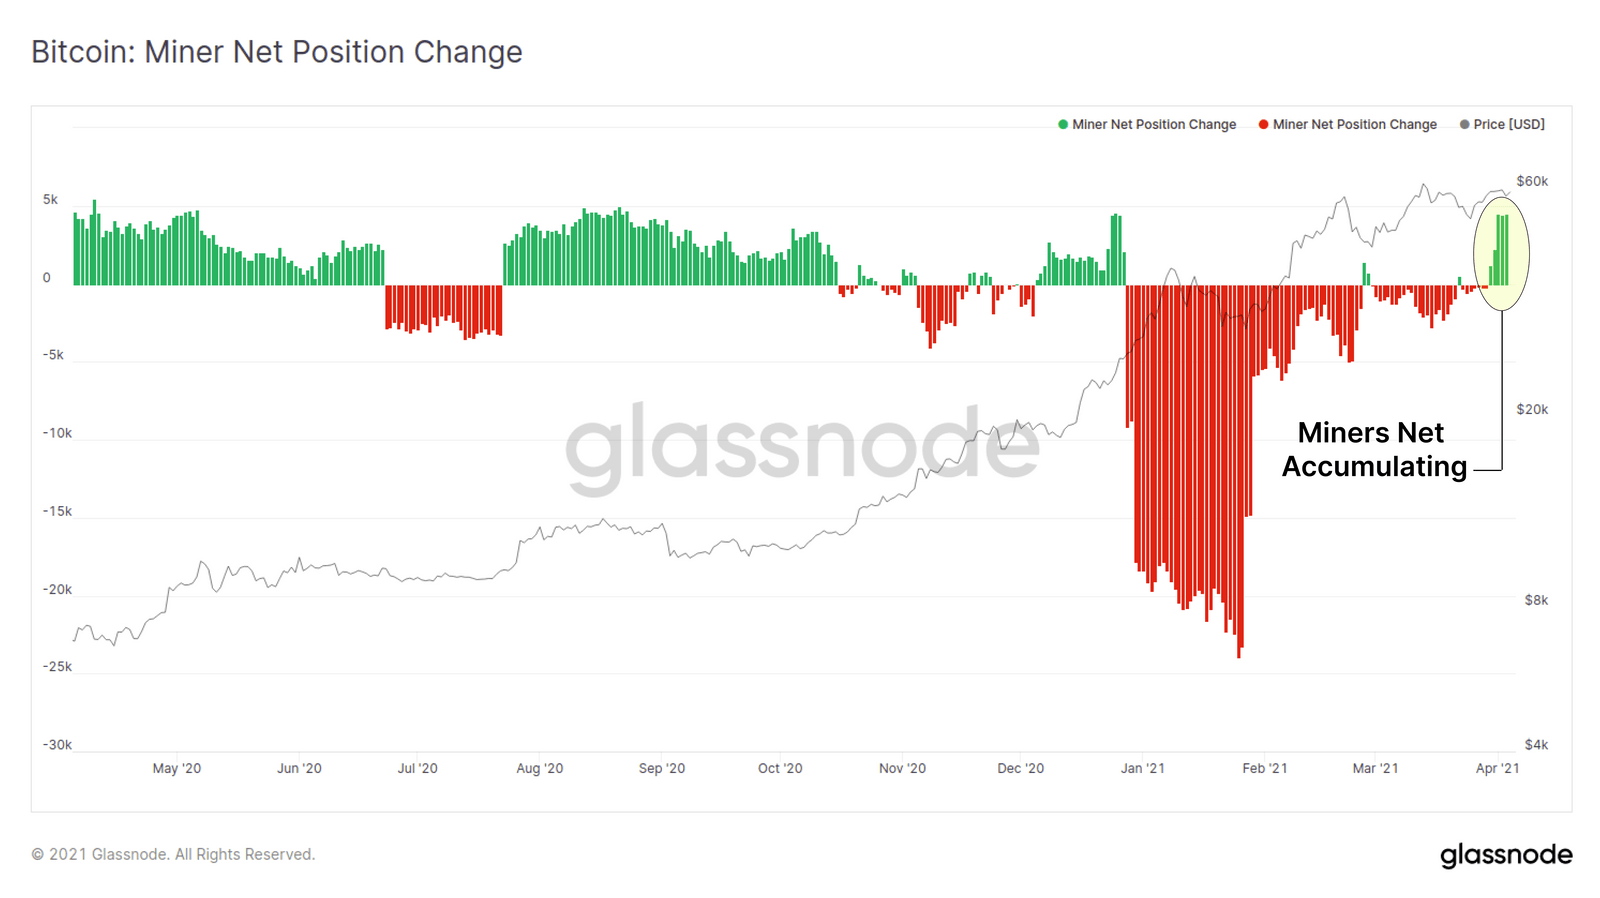
- Miners have returned to accumulation mode.
- Ascending wedge pattern projects another marginal high before reversing.

Bitcoin price has failed to close above $60,000 on a daily basis since March 13 but has been supported by the 21-day simple moving average (SMA) over the last seven days. Overall, the technical picture has tilted bearish in the short-term while the on-chain metrics are mixed. The complex picture makes it prudent to wait for the unpredictable directional movement to resolve in either direction.
Bitcoin price boxed in by underlying fundamentals
On the bullish side of the ledger, BTC miners, albeit an increasingly smaller influence as sell-side entities compared to daily trade volume, are net accumulating bitcoin at levels last seen in December 2020.
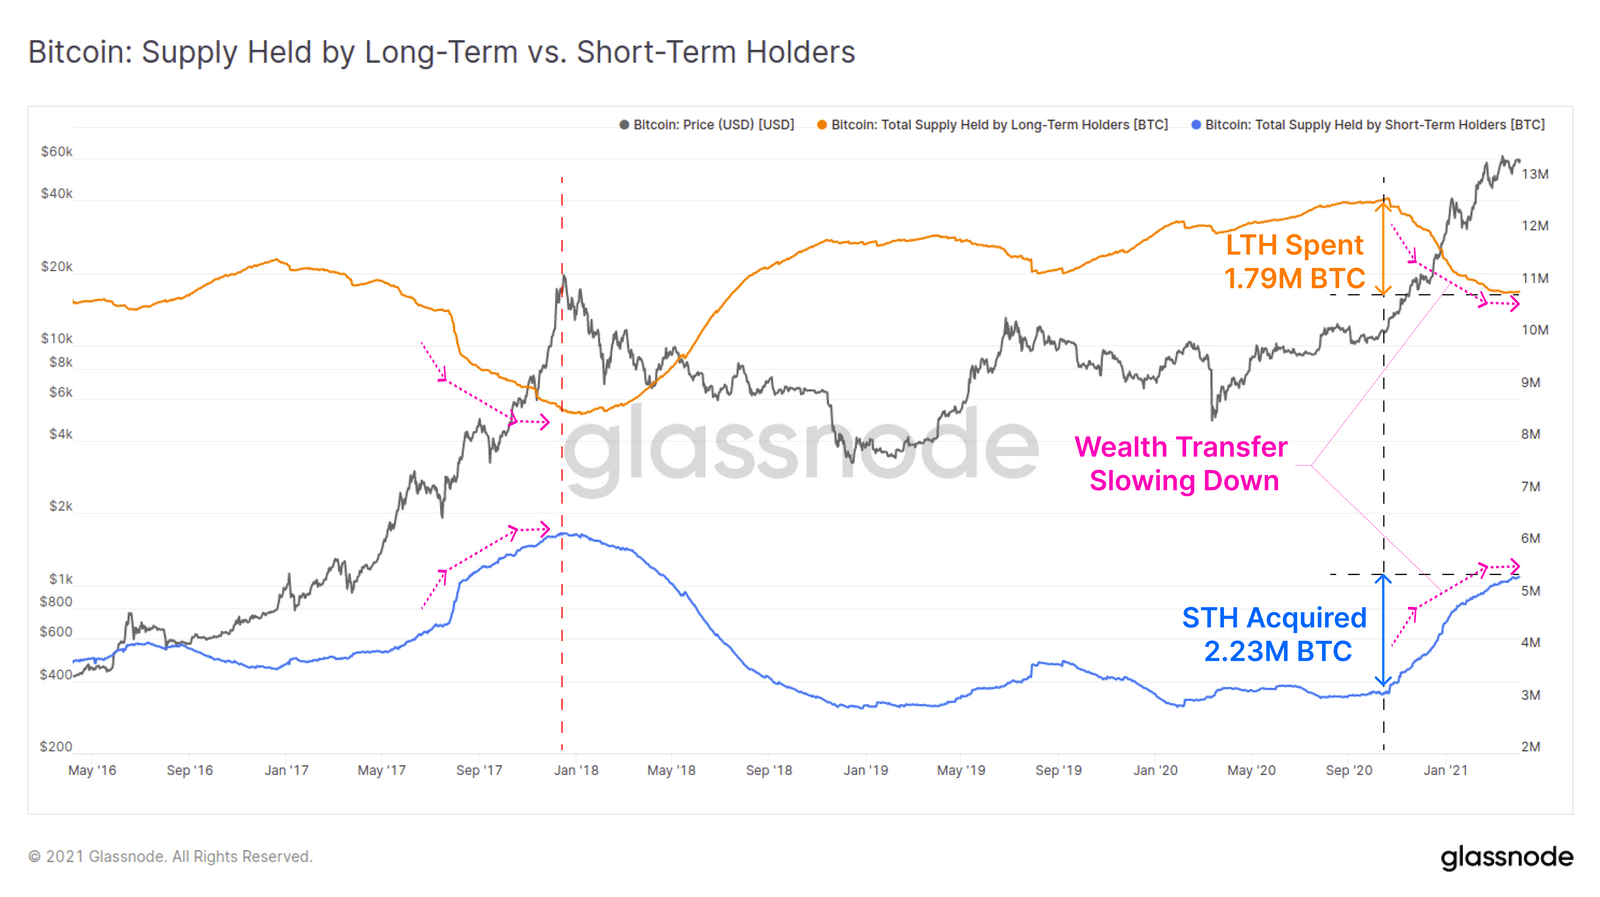
On the flipside, short-term holders have accumulated around 440k more BTC than long-term holders have spent over the previous six months, indicating a burgeoning new demand hitting the market. The problem is, this type of wealth transfer occurred at the 2017 peak.
Yes, BTC has closed above the $1 trillion market capitalization for ten consecutive days, but it has not gotten any closer to resolving the heavy resistance at $60,000. As an observation, the bellwether token has registered four daily dojis just below the psychologically important level since March 20, reflecting the balance between supply and demand.
The long-term outlook for BTC remains positive, but it is important to entertain the potential that it is forming a complex top in the short term in the form of an ascending wedge pattern.
The wedge pattern could last a few more weeks, and BTC should print at least one more marginal high before strongly reverting to the downside. Support first appears at the intersection of the 50-day SMA with the wedge’s lower trendline at $54,000, followed by the March low at $50,305.
A deeper correction puts the 100-day SMA in play at $45,057 and then the February 28 low at $43,106.
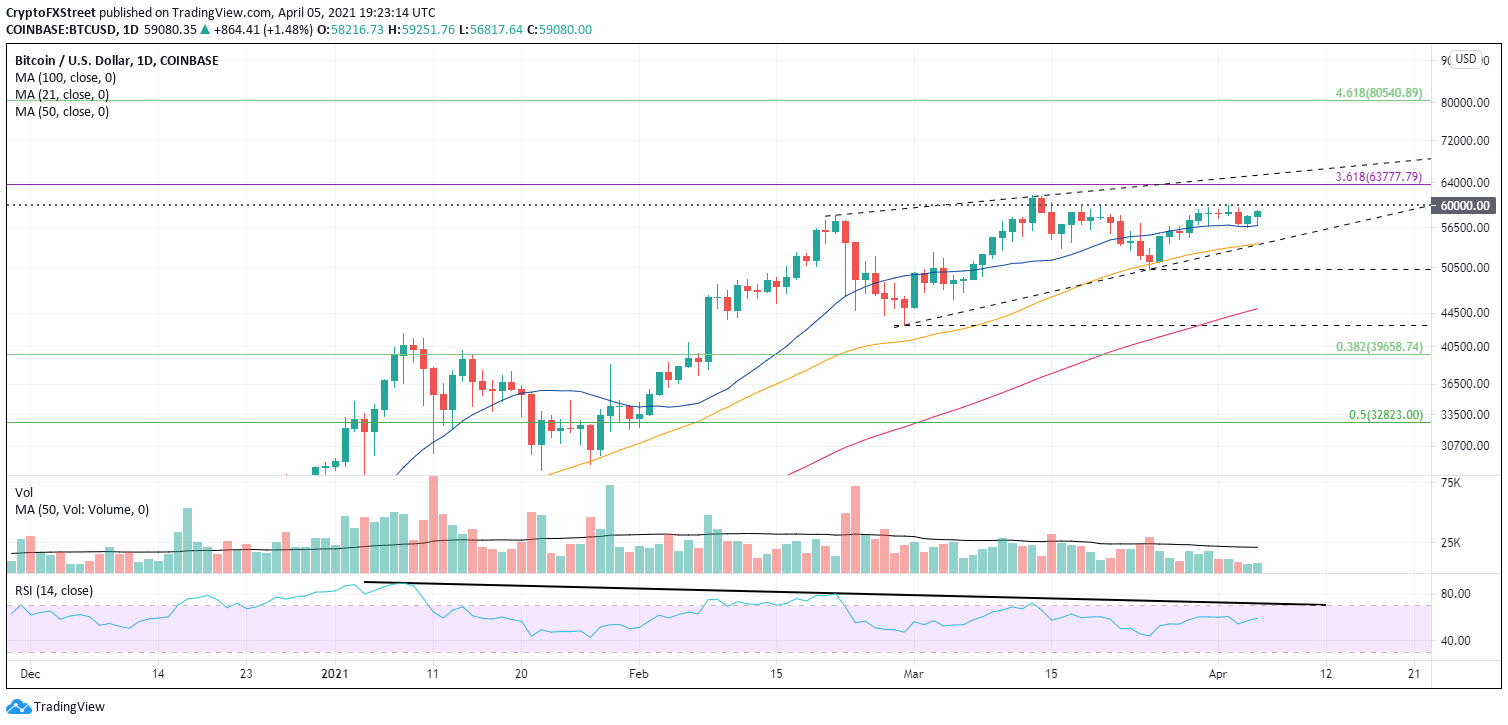
BTC/USD daily chart
A bullish resolution of the pattern would release BTC to test the 4.618 Fibonacci extension of the 2017-2018 bear market at $80,541. Higher targets would need to be evaluated after the resolution.
Over the last few weeks, adoption momentum has surpassed anything in the past, but it has not sprung BTC higher, begging the question of whether the good news is priced in.
Author

Sheldon McIntyre, CMT
Independent Analyst
Sheldon has 24 years of investment experience holding various positions in companies based in the United States and Chile. His core competencies include BRIC and G-10 equity markets, swing and position trading and technical analysis.


