Bitcoin price prediction: BTC/USD sandwiched between massive resistance and support levels
- BTC/USD went up from $10,190 to $10,223.45 this Wednesday.
- The daily confluence detector shows three massive resistance levels on the upside.

Bitcoin managed to have a bullish day after five straight bearish days. So far today, BTC/USD has gone up from $10,190 to $10,223.45. The hourly chart shows us that BTC/USD went up to $10,253, where it met resistance and dropped down to $10,223.45. The daily confluence detector indicates that the price is sandwiched between massive stacks of resistance and support levels.
BTC/USD daily confluence detector
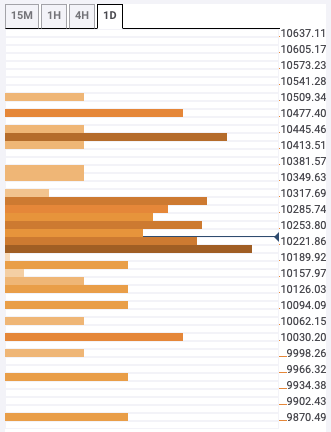
On the upside, resistance levels lie at $10,275, $10,300 and $10,430. $10,275 has the five-day Simple Moving Average (SMA 5), SMA 50, SMA 200 and 15-min previous high. $10,300 has the SMA 10 and 1-week Fibonacci 61.8% retracement level. Finally, $10,430 has the four-hour Bollinger band upper curve.
On the downside, the support stack lies between $10,200 - $10,220. It has the SMA 5, SMA 10, SMA 100, SMA 200, one-hour previous low, one-hour Bollinger band middle curve, one -day Bollinger band middle curve, 15-min Bollinger band middle curve and one-day Fibonacci 38.2% retracement level.
Author

Rajarshi Mitra
Independent Analyst
Rajarshi entered the blockchain space in 2016. He is a blockchain researcher who has worked for Blockgeeks and has done research work for several ICOs. He gets regularly invited to give talks on the blockchain technology and cryptocurrencies.


