Bitcoin price prediction: BTC/USD keeps trending in a narrow range as bears take over this Tuesday
- BTC/USD had gone up from $9,207.30 to $9,413.30 this Monday.
- The price of the asset is held up by the support stack at $9,255-$9,300.

BTC/USD has had a bearish start to the day as the price has gone down from $9,413.30 to $9,380. Before this, the asset had a big bullish day this Monday, wherein it jumped from $9,207.30 to $9,413.30. Overall, BTC/USD is still trending horizontally in a ~$400 range. Looking at the hourly breakdown for Monday and Tuesday, we can see an intraday support at $9,137.25, which BTC/USD used to bounce up. After a steady rise, BTC/USD spiked from $9,227.90 to $9,473.90 in just one hour. Since then, the price has been on a decline and has currently settled itself around $9,380.
BTC/USD daily confluence detector
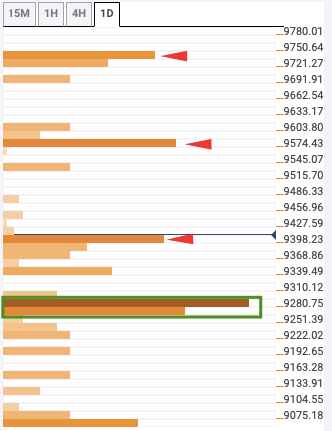
On the upside, there are three resistance levels of not at $9,400, $9,585 and $9,750. $9,400 has the four-hour Bollinger band upper curve and five-day Simple Moving Average (SMA 5) curve. $9,585 has the one-week Fibonacci 38.2% and one-day Fibonacci 161.8% retracement levels, while $9,750 has the one-month Fibonacci 23.6% retracement level.
On the downside, there is a healthy support stack from $9,255-$9,300. It has the one-month Fibonacci 38.2% retracement level, one-day Fibonacci 61.8% retracement level, SMA 5, SMA 50, four-hour previous low, 15-min Bollinger band lower curve, SMA 100, four-hour Bollinger band middle curve, and one-hour Bollinger band middle curve.
Author

Rajarshi Mitra
Independent Analyst
Rajarshi entered the blockchain space in 2016. He is a blockchain researcher who has worked for Blockgeeks and has done research work for several ICOs. He gets regularly invited to give talks on the blockchain technology and cryptocurrencies.


