Bitcoin price might crash violently ahead of US CPI release, dragging altcoins with it
- Bitcoin price seems to have formed a local top at $17,398 after a 4.3% rally.
- Investors should prepare for a correction to $16,000 or lower, depending on the circumstances.
- A six-hour candlestick close above $17,800 will invalidate the bearish thesis for BTC.

Bitcoin price shows that the market is primed for a reversal from multiple perspectives. Although BTC has rallied only by a small amount, some altcoins have more than doubled in the last week. Therefore, altcoin traders need to be careful this week as things could shift for the worse.
How will Bitcoin price react to US CPI release?
With the US Consumer Price Index (CPI) announcement on January 12, things could get dicey, especially if inflation surprises to the upside. Bitcoin has been profiting from a weaker US Dollar since the start of 2023, as the US Federal Reserve (Fed) is leaning toward a smaller 25 basis points interest rate hike on its next monetary policy meeting on February 1. According to the CME FedWatch tool, the market is currently discounting a 78.2% of target interest rates being in the 4.50%-4.75% range after the next Fed meeting, giving only a 21.8% chance to a 50 basis points interest rate hike.
Here is where the importance of the US CPI release of Thursday comes – higher-than-expected inflation numbers for the month of December, particularly in the core indicators (expected at 0.3% monthly and 5.7% yearly) would likely make the Fed reconsider again its monetary policy, triggering a US Dollar buying spree across the board, and punishing cryptocurrencies and Bitcoin.
As a result, it could add a tailwind to the already bearish technicals of Bitcoin price and trigger a market-wide sell-off.
Bitcoin price at an inflection point
Bitcoin price shows that it has formed multiple tops over the last two months or so. Looking closely at BTC, Stochastics and Relative Strength Index show a clear trend and signals to identify the exhaustion of the upswings.
The chart attached below shows two important observations:
- Every time the Stochastic indicator produced a bearish crossover in the overbought territory, ie., above 80, a correction is triggered.
- While some countertrend rallies are sharp, others are slow and are less in magnitude. In addition to Stochastic’s bearish crossover in the overbought zone, if the RSI is also in the overbought zone ie., above 70, the chances of a correction increase.
Both the aforementioned conditions have been fulfilled twice in the last two months, where BTC has crashed 27% and 11%, respectively. With the latest market reversal signal occurring late Monday, Bitcoin price is primed for a quick downtrend.
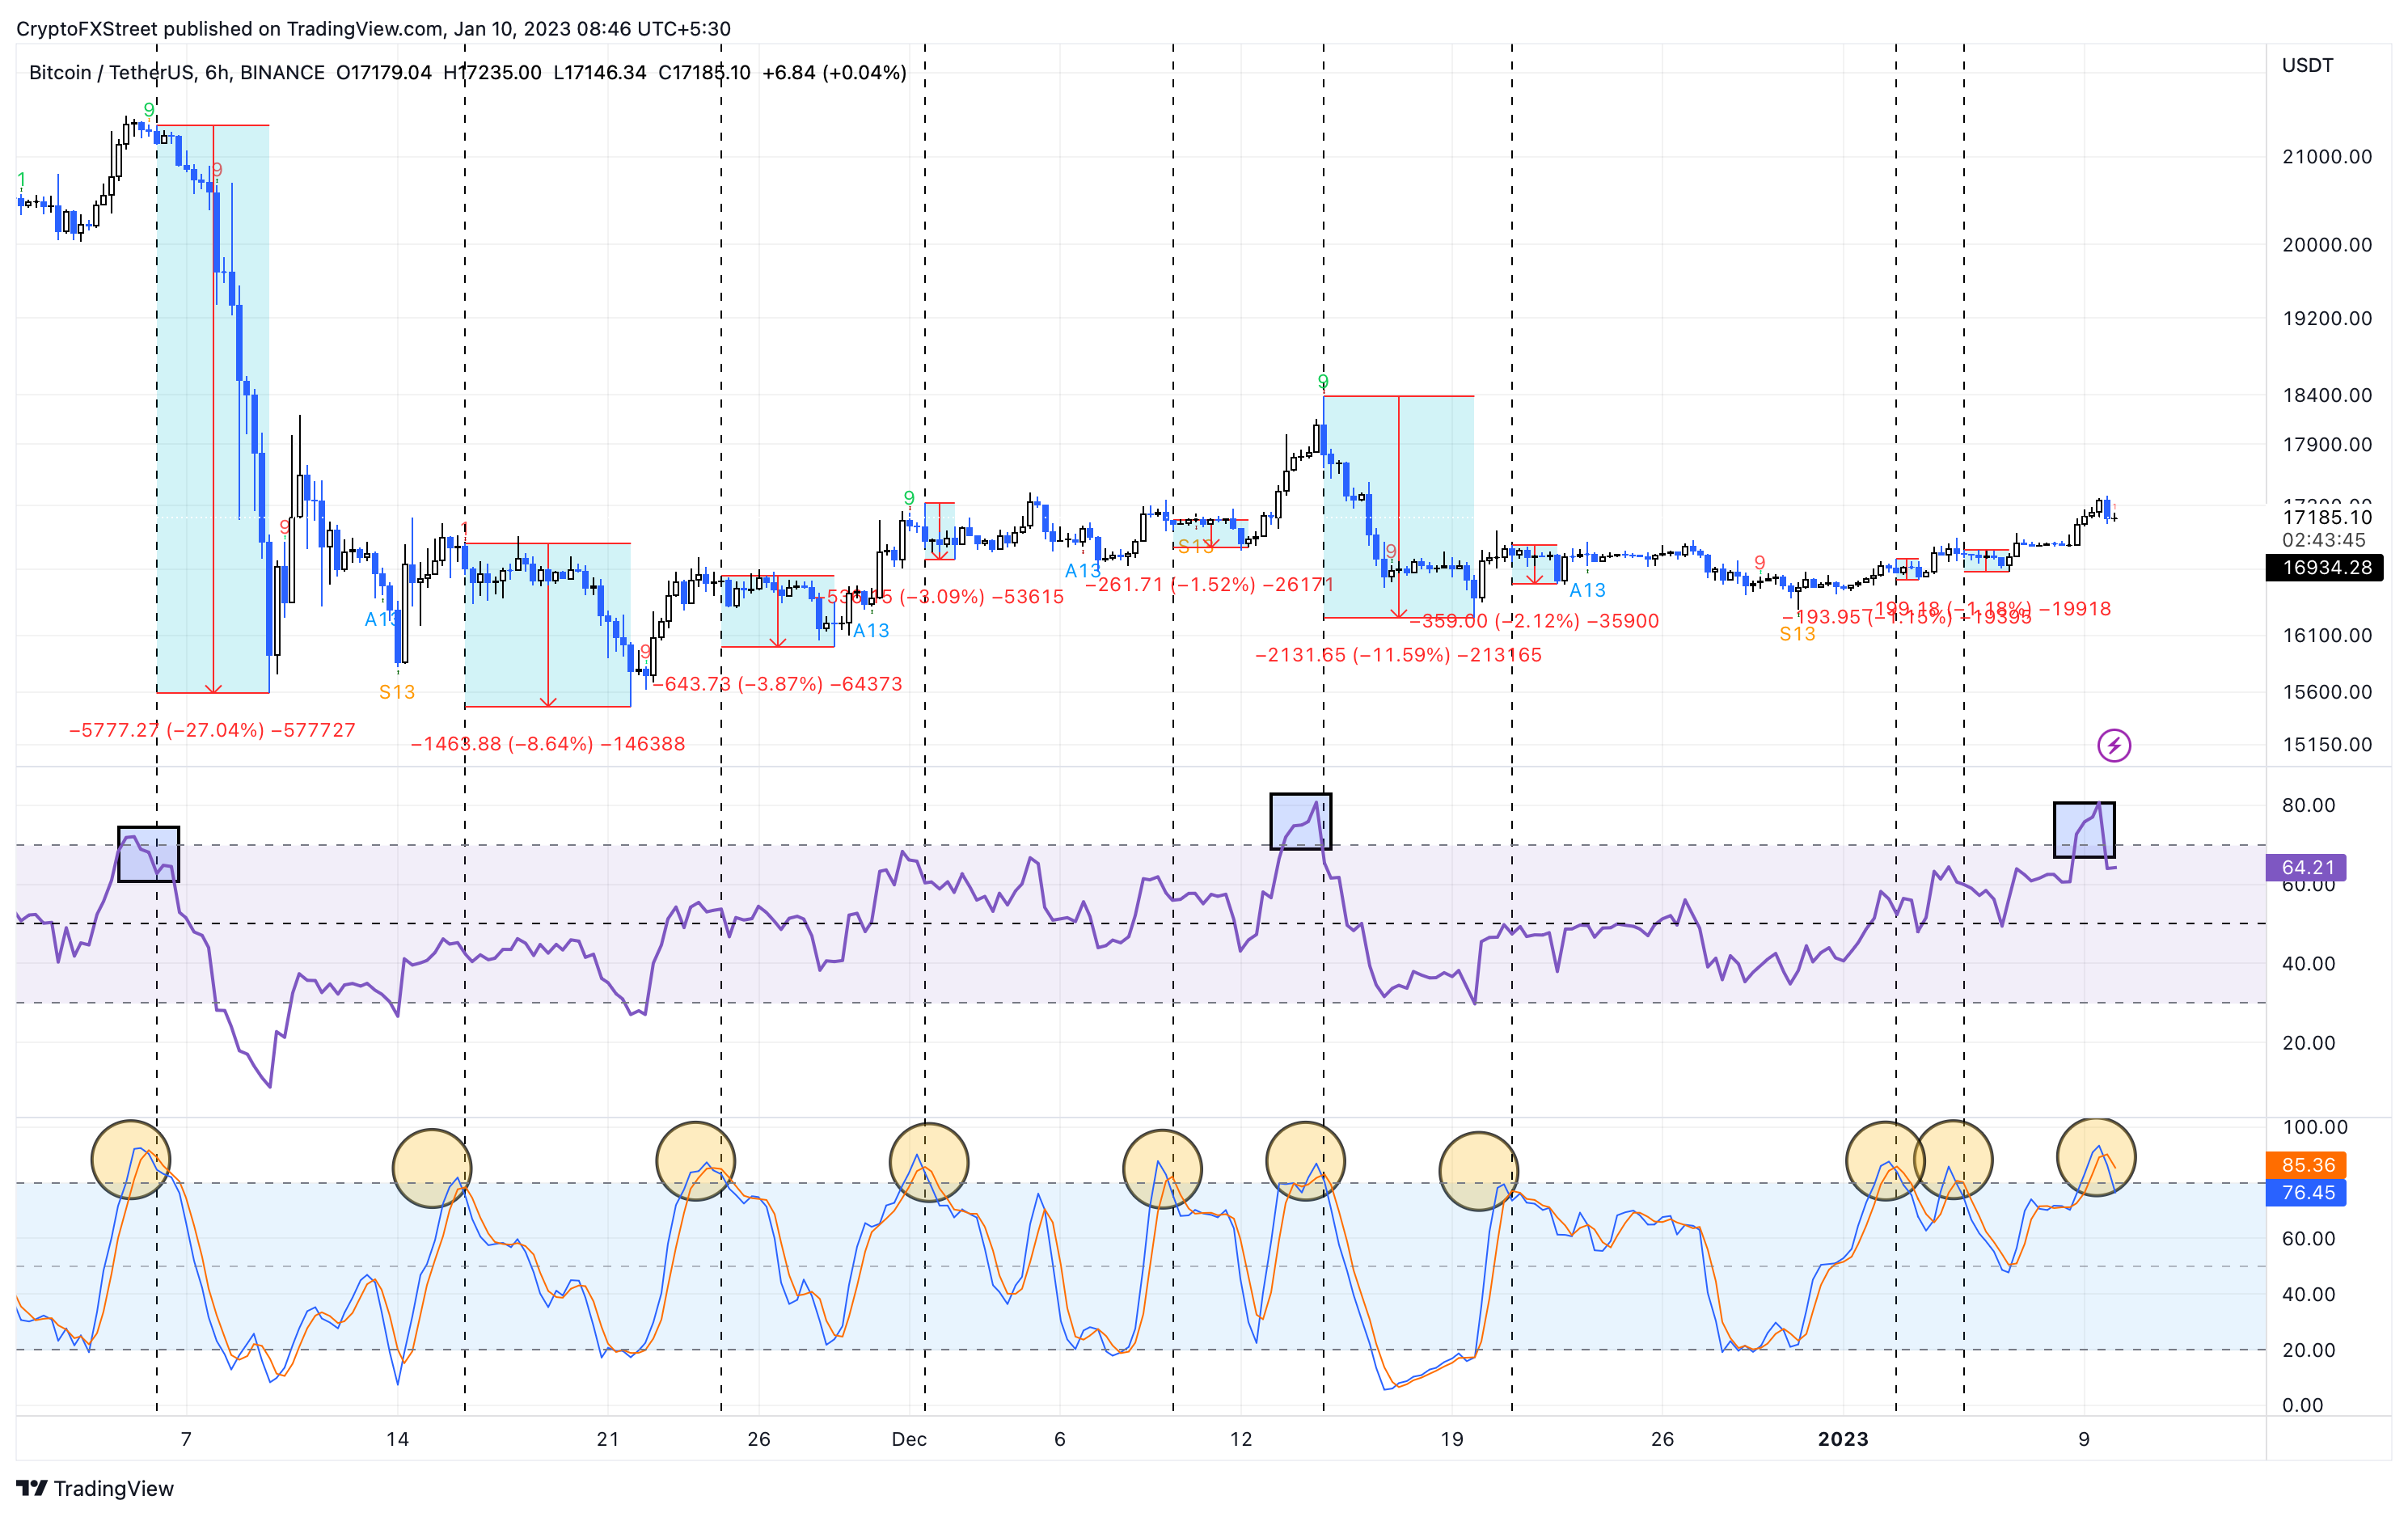
BTC/USDT 6-hour chart
To identify the key levels Bitcoin price will visit, investors need to pay attention to the chart attached below. The four-hour chart shows that BTC has filled a significant inefficiency known as Fair Value Gap (FVG), extending roughly from $17,000 to $17,300.
A bearish engulfing candlestick has already formed on the four-hour chart, with a massive hurdle present at $17,800. Hence, a retracement from the current position will knock BTC down to retest the $16,830 support level.
If sellers continue to pour in, then Bitcoin price could revisit the $16,624 barrier, resting below which is sell-stop liquidity due to the higher lows.
The ideal place for bears to rest would be after the collection of the sell-stop liquidity below the equal lows formed at $15,443.
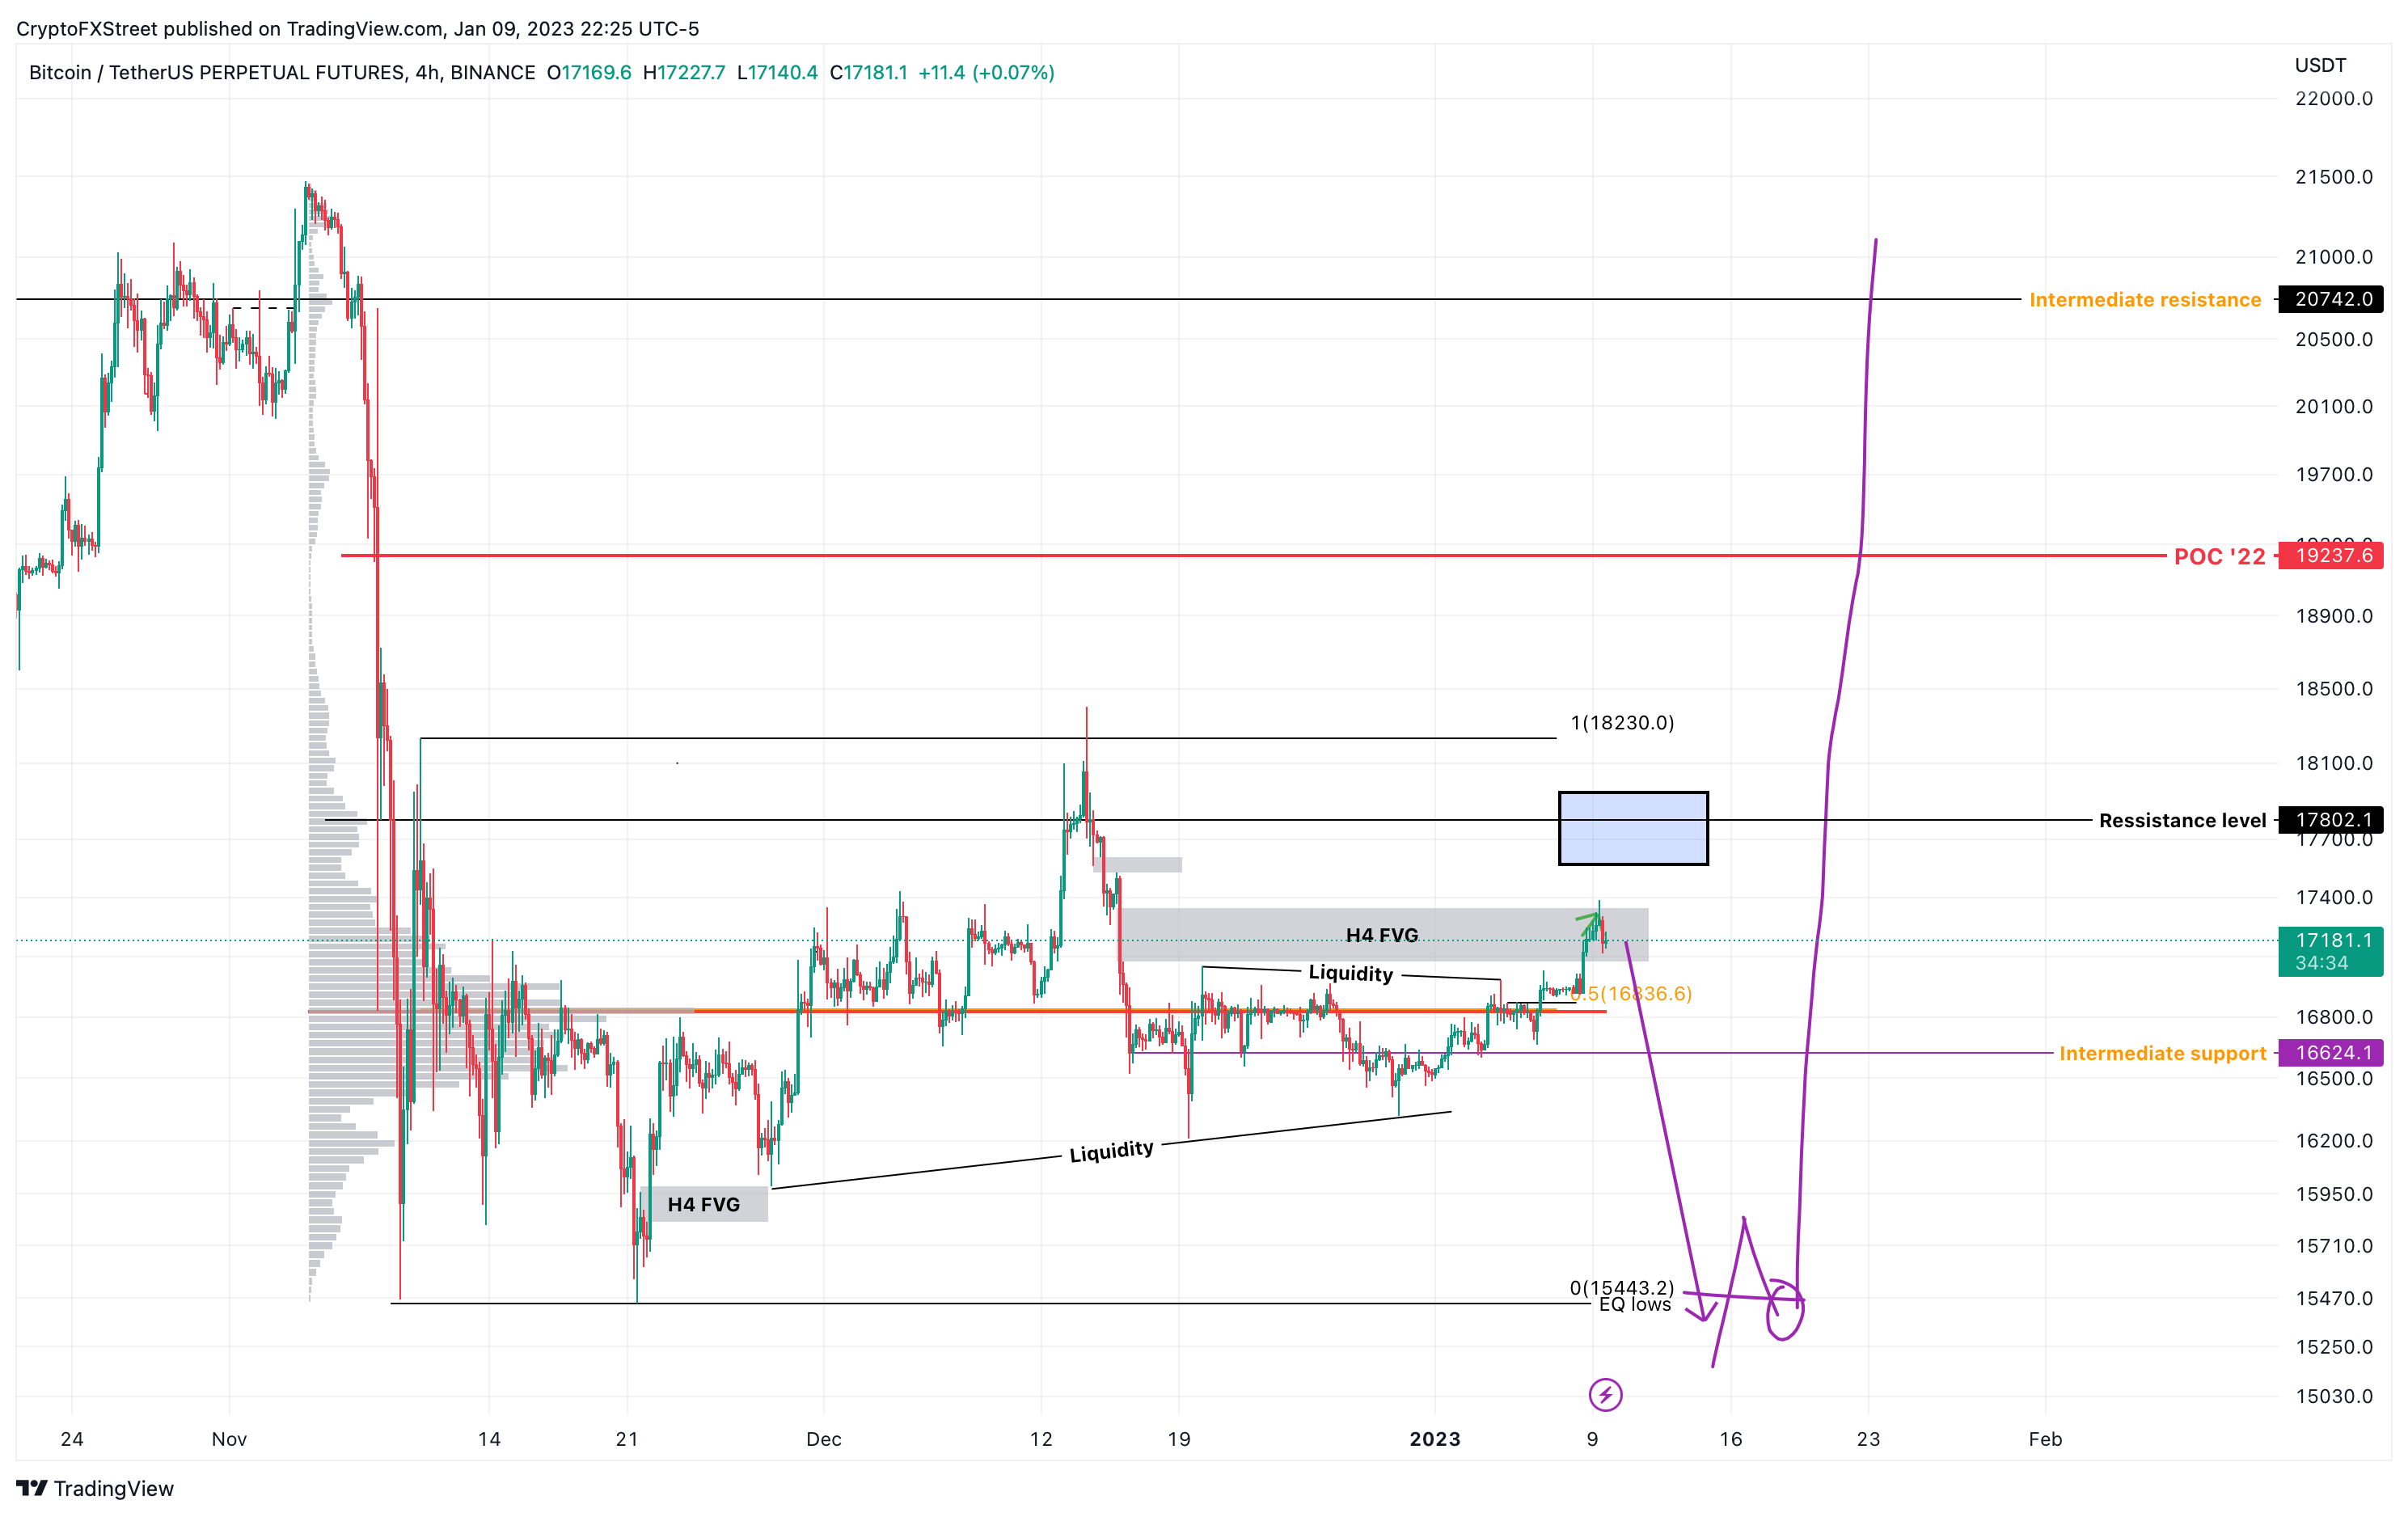
BTC/USDT 4-hour chart
While the bearish outlook for Bitcoin price sounds a little surprising, all evidence is in support of it. If the buyers make a comeback, they could potentially undo the local top formation trend that has been in place for more than two months.
This move will happen if Bitcoin price produces a four-hour candlestick close above $17,800. In such a case, BTC will have a chance to flip the range high at $18,230 and continue its uptrend to $19,237.
Author

Akash Girimath
FXStreet
Akash Girimath is a Mechanical Engineer interested in the chaos of the financial markets. Trying to make sense of this convoluted yet fascinating space, he switched his engineering job to become a crypto reporter and analyst.


