|

Bitcoin Price Forecast: BTC/USD drops down after charting evening star pattern

  • BTC/USD bears have stayed in control for the second straight day.
  • The price has fallen below the SMA 20 and SMA 50 curves.
  • The Elliott Oscillator has had a red session following two straight green sessions.

BTC/USD daily chart

BTC/USD daily chart

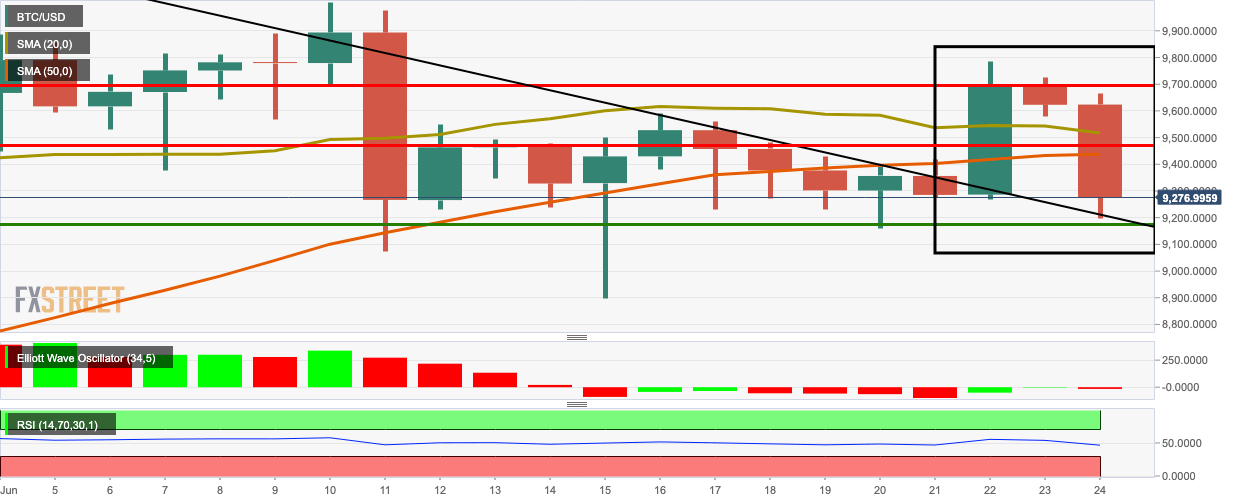
BTC/USD bears stayed in control for the second straight day as it charted the evening star pattern. The price plummeted from $9,623.62 to $9,277.70 and dropped below the SMA 20 and SMA 50 curves. The Elliott Oscillator has had a red session, following two straight green sessions. Meanwhile, the RSI indicator has dropped to 45.35 after the bearish price action.

Support and Resistance

BTC/USD has strong resistance levels at $9,700, $9,517.20 (SMA 20), $9,472.25 and $9,438.55 (SMA 50). On the downside, the bears will want to conquer support levels at $9,206.30 (downward trending line) and $9,175 to negative momentum.

Key levels

BTC/USD

Overview
Today last price9275.08
Today Daily Change-347.89
Today Daily Change %-3.62
Today daily open9622.97
 
Trends
Daily SMA209543.28
Daily SMA509433.13
Daily SMA1008221.89
Daily SMA2008282.17
 
Levels
Previous Daily High9723.24
Previous Daily Low9577.51
Previous Weekly High9589.87
Previous Weekly Low8899.05
Previous Monthly High10074.48
Previous Monthly Low8105.58
Daily Fibonacci 38.2%9633.18
Daily Fibonacci 61.8%9667.57
Daily Pivot Point S19559.24
Daily Pivot Point S29495.51
Daily Pivot Point S39413.51
Daily Pivot Point R19704.97
Daily Pivot Point R29786.96
Daily Pivot Point R39850.69


Author

Rajarshi Mitra

Rajarshi Mitra

Independent Analyst

Rajarshi entered the blockchain space in 2016. He is a blockchain researcher who has worked for Blockgeeks and has done research work for several ICOs. He gets regularly invited to give talks on the blockchain technology and cryptocurrencies.

More from Rajarshi Mitra
Share:

Editor's Picks

XRP holds $1.40 amid ETF inflows and stable derivatives market

Ripple trades under pressure, with immediate support at $1.40 holding at the time of writing on Tuesday. A recovery attempt from last week’s sell-off to $1.12 stalled at $1.54 on Friday, leading to limited price action between the current support and the resistance.

Crypto Today: Crypto market holds $2.4 trillion as bearish sentiment persists around Bitcoin, Ethereum, XRP 

The Crypto King, Bitcoin, is constrained below $70,000, with the price holding around $69,000. Altcoins, including Ethereum and Ripple, exhibit technical weakness but are holding above key support levels at $2,000 and $1.40, respectively.

Aster tests resistance as whale activity, perpetuals volume surge

Aster (ASTER) edges higher by over 7% at press time on Thursday, crossing above its 200-period Exponential Moving Average (EMA) on the 4-hour chart while testing a long-term resistance trendline on the daily.

Bitcoin slips below $69,000 as crypto market shows cautious stabilization

Bitcoin price is nearing the lower consolidation boundary, trading below $69,000 at the time of writing on Tuesday. A breakdown below this key level would suggest a correction toward $60,000. However, institutional and corporate demand support a short-term stabilization in BTC.

Bitcoin Price Annual Forecast: BTC holds long-term bullish structure heading into 2026

Bitcoin (BTC) is wrapping up 2025 as one of its most eventful years, defined by unprecedented institutional participation, major regulatory developments, and extreme price volatility.

Bitcoin: The worst may be behind us

Bitcoin (BTC) price recovers slightly, trading at $65,000 at the time of writing on Friday, after reaching a low of $60,000 during the early Asian trading session. The Crypto King remained under pressure so far this week, posting three consecutive weeks of losses exceeding 30%.