Bitcoin Price Forecast: BTC/USD bulls aim for $11,600, but strong resistance restricts movement – Confluence Detector
- BTC/USD has strong resistance levels at $12,300 and $11,615.
- Correlation between BTC and gold has reached all-time high levels.

BTC/USD daily confluence detector
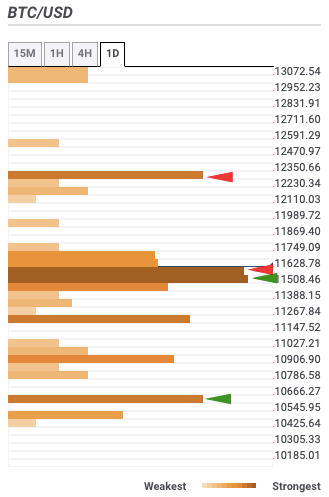
BTC/USD has gone up from $11,568.60 to $11,596 as bulls continue to flirt around the $11,600 line. As per the daily confluence detector, there are two strong resistance levels at $12,300 and $11,615.
The $12,300-level has the Previous Month high. $11,615 has a strong confluence level highlighted by the one-week Fibonacci 61.8% retracement level and one-day Fibonacci 23.6% retracement level. $12,300 has the one-week and one-month Pivot Points resistance-one.
On the downside, we have healthy support levels at $11,525 and $10,600.
$11,525 has the Previous Month high. $10,600 has the Previous Week low. Finally, the $10,600-level has the Previous Week low.
Bitcoin and Gold Correlation
The monthly correlation rate between gold and Bitcoin has recently reached an all-time high of 70%, surpassing the peaks recorded in 2018 and 2019, according to Skew Analytics.
Bitcoin/Gold 1 mth correlation reaching new all-time highs, giving momentum to the store-of-value narrative for BTC in these "money printer go brrr" times. pic.twitter.com/hr7l8GPvF8
— skew (@skewdotcom) August 10, 2020
Skew Analytics noted that such high correlation rates echo Bitcoin's narrative as a safe haven during times of uncertainty. As governments and central banks are increasingly printing more money to "save" their economies, investors appear to be switching from fiat currencies (prone to inflation) to harder assets.
In an earlier interview with KMID, Donald Trump, the President of the US, said that the next round of COVID-19 packages "may go higher" than the previous series of $1,200 per individual. He added:
I'd like to see it be very high, because I love the people. I want the people to get it.
Because of government spending like this, Bitcoin and gold have surged in price throughout 2020. BTC reached a yearly high of $12,000 just as gold hit a historic $2,000 per ounce. However, both markets have fallen back significantly in recent times. They have been positively correlated. Bitcoin dropped by 4% to $11,200 a recently while gold suffered its worst slide in more than seven years.
Popular Bitcoin critic and a gold advocate, Peter Schiff, took to Twitter to calm gold investors.
Misguided traders are once again selling gold in reaction to much hotter than expected inflation data. July producer prices surged .6%, twice estimates and the biggest rise in 2 years. Inflation will continue pushing prices higher, especially #gold, as real interest rates fall.
— Peter Schiff (@PeterSchiff) August 11, 2020
Notably, the RSI indicates that gold is currently overbought and is close to a sell-off, while Bitcoin is still in a market equilibrium zone. RSI is an indicator that shows whether buyers or sellers are dominating a market.
Author

Rajarshi Mitra
Independent Analyst
Rajarshi entered the blockchain space in 2016. He is a blockchain researcher who has worked for Blockgeeks and has done research work for several ICOs. He gets regularly invited to give talks on the blockchain technology and cryptocurrencies.



