Bitcoin Price Forecast: BTC upside limited at $10,600 – Confluence Detector
- BTC has managed to stay on top of the $10,000-mark for 66 straight days.
- The parabolic SAR has reversed from bullish to bearish in the 4-hour price chart.

Despite a price drop, the premier cryptocurrency has managed to stay above $10,000 for a record-breaking 66th straight day. However, how long is this streak going to last? Let’s find out.
BTC/USD 4-hour chart
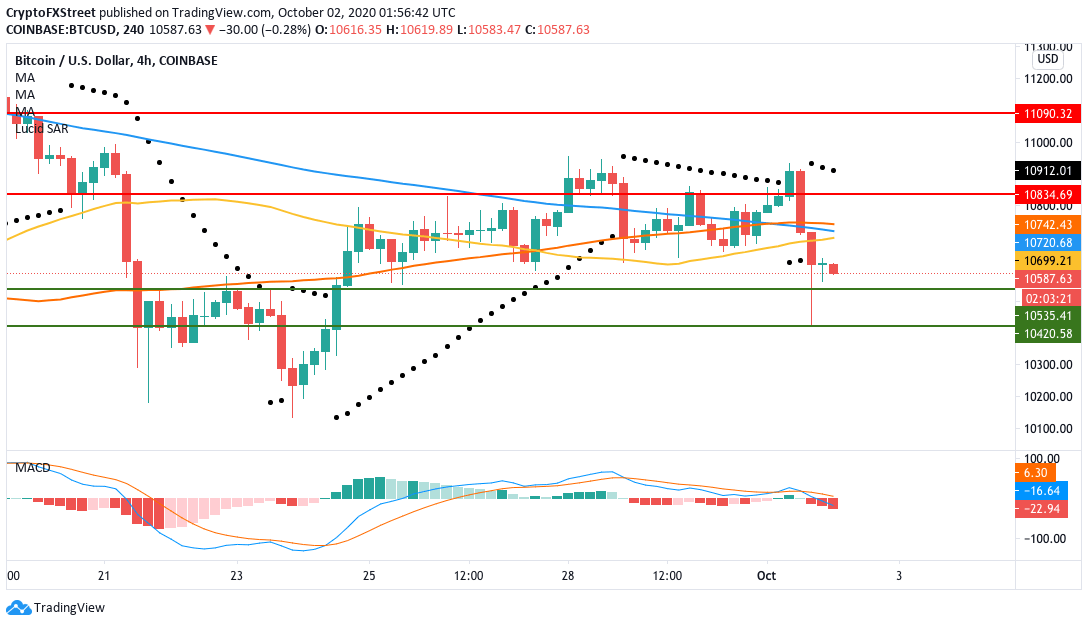
The parabolic SAR has reversed from bullish to bearish in the 4-hour chart. This reversal happened after the price plummeted from $10,900 to $10,600. In the process, the price broke below the SMA 50, SMA 100 and SMA 200 curves. The MACD shows increasing bearish market momentum, which will probably drop the price down to the $10,535 support level in the short term.
Before we see the daily price chart, let’s check our daily confluence detector.
BTC/USD daily confluence detector
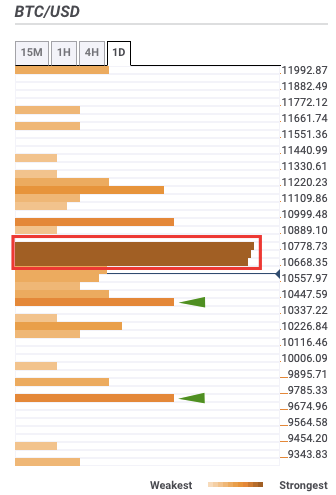
The BTC daily confluence detector shows a robust stack of resistance between $10,625-$10,800. On the downside, there are two moderate support levels at $10,400 and $9,750.
Now, let’s check the daily BTC chart.
BTC/USD daily chart

The price trends in a symmetric triangle pattern as the bulls and bears keep canceling each other out. However, with a strong resistance stack on top (as detected by the confluence detector), the upside potential is severely limited. If BTC does have a bearish breakout from the triangle, it can potentially drop down to the SMA 200, which is hovering around $9,400.
The flipside – Keeping the streak alive
However, the news isn’t all doom and gloom for the crypto market leader.
As per Cryptoquant, Bitcoin exchange reserves have dropped by $5 billion in the past year. This indicates heightened accumulation by Bitcoin Whales. The total reserve across all exchanges have plummeted to 2.4 million Bitcoin ($25 billion). In comparison, exchanges had around 2.8 million Bitcoin ($30 billion) in October 2019.
The reduction in Bitcoin held in exchanges suggests that more investors see BTC as a hedge against inflation. A decrease in Bitcoin deposits into exchanges generally signifies increased selling pressure. This usually drives prices up as more investors are less inclined to sell their holdings.
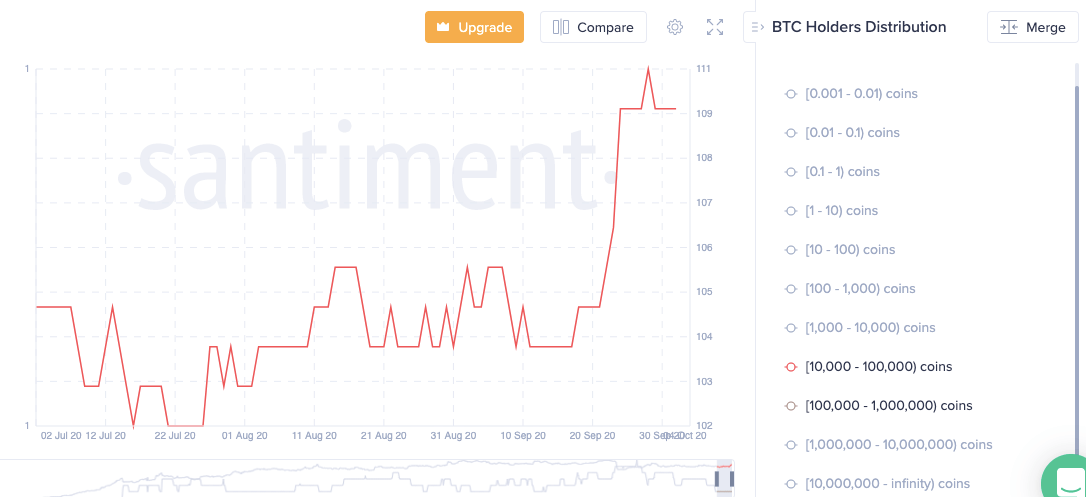
Santiment also shows that the number of whales holding 10,000-100,000 BTC has gone up from 104 to 110 over the last 15 days.
So, while market speculation may have dropped the coin’s valuation, long-term holders are still treating it as an inflation hedge and a legit store-of-value. This positive sentiment could help Bitcoin in overcoming the bears and staying above the $10,000-mark.
Author

Rajarshi Mitra
Independent Analyst
Rajarshi entered the blockchain space in 2016. He is a blockchain researcher who has worked for Blockgeeks and has done research work for several ICOs. He gets regularly invited to give talks on the blockchain technology and cryptocurrencies.


