Bitcoin Price Forecast: BTC rejected from $120,000 as momentum cools, mild ETF outflows continue
- Bitcoin price edges lower on Wednesday after testing the upper band of a consolidation range near $120,000.
- US-listed spot Bitcoin ETFs record a second straight day of outflows, with $67.93 million exiting on Tuesday.
- Technical indicators signal a weakening of bullish momentum, suggesting a possible short-term correction ahead.

Bitcoin (BTC) trades slightly down to near $118,000 when writing on Wednesday after testing the upper boundary of a consolidation range near $120,000 earlier in the day. The decline comes amid a second consecutive day of outflows this week from US-listed spot Bitcoin Exchange Traded Funds (ETFs), signaling cautious sentiment among institutional investors. The technical outlook also suggests a short-term correction, as momentum indicators show signs of exhaustion.
Bitcoin spot ETFs show early signs of weakness
SoSoValue data shows that US spot Bitcoin ETFs recorded a second consecutive day of outflows this week, with $67.93 million exiting on Tuesday. If this trend continues and intensifies, Bitcoin price could face a correction.
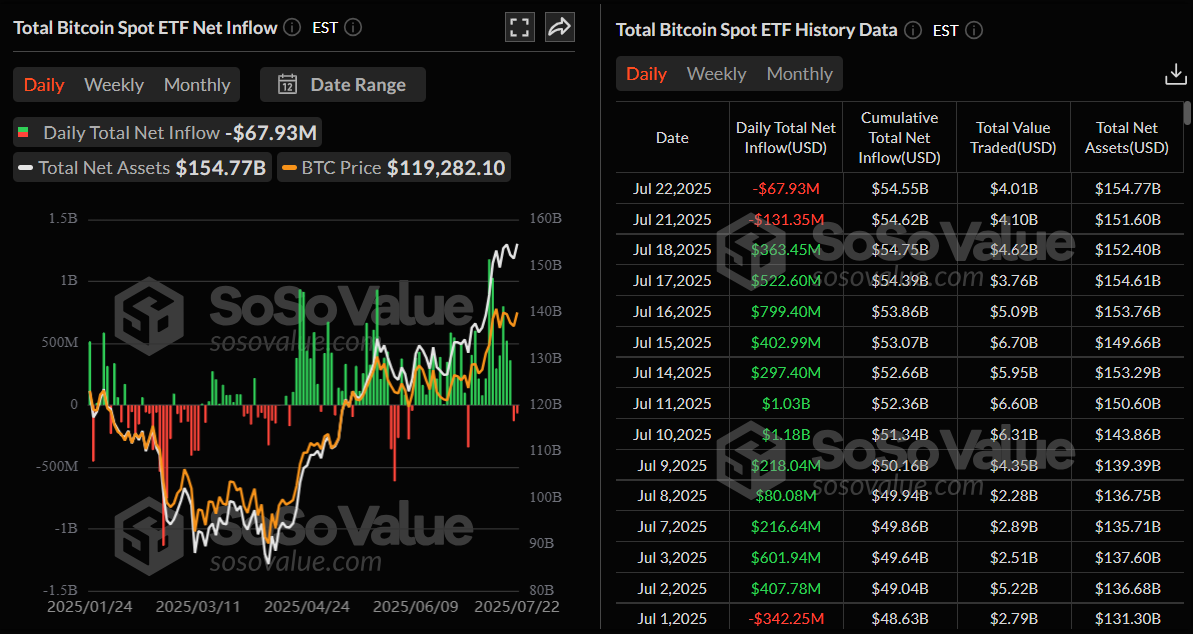
Total Bitcoin Spot ETFs daily chart. Source: SoSoValue
CryptoQuant data also showed a surge in Short-Term Holder (STH) activity on Binance, signaling potential profit-taking by retail investors.
The graph below shows that the metric had recently crossed the 0.4 threshold this week. This level, previously associated with retail-driven sale activity, often coincides with local bottoms after a massive surge in BTC, which could cause a short-term correction in BTC price.
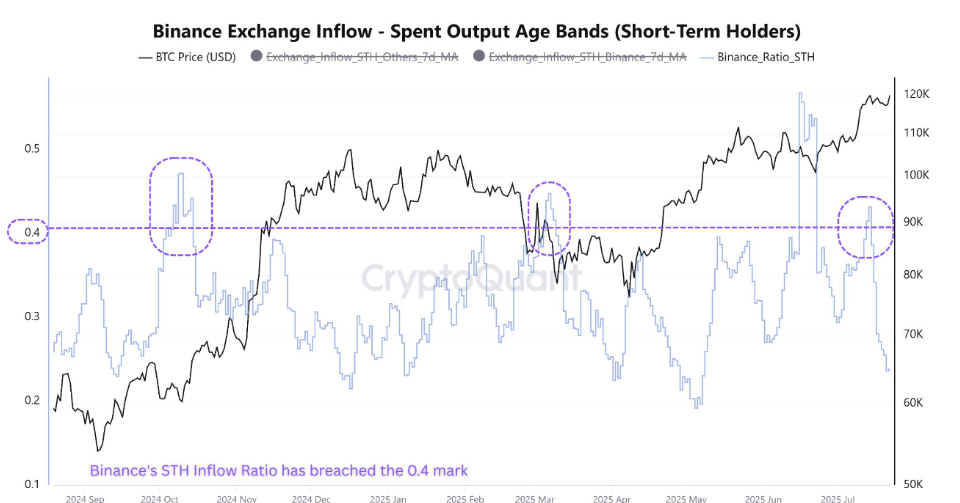
BTC STH activity chart. Source: CryptoQuant
Some signs of optimism
Despite mild outflow in institutional demand and selling activity from retail investors, some whales are still accumulating BTC.
CryptoQuant data below shows that over 9,600 BTC were withdrawn from the Kraken exchange on Tuesday, marking one of the largest single day withdrawals from the exchange in recent months. Such development reduce immediate sell-side liquidity, which could absorb the selling pressure from the retail side.
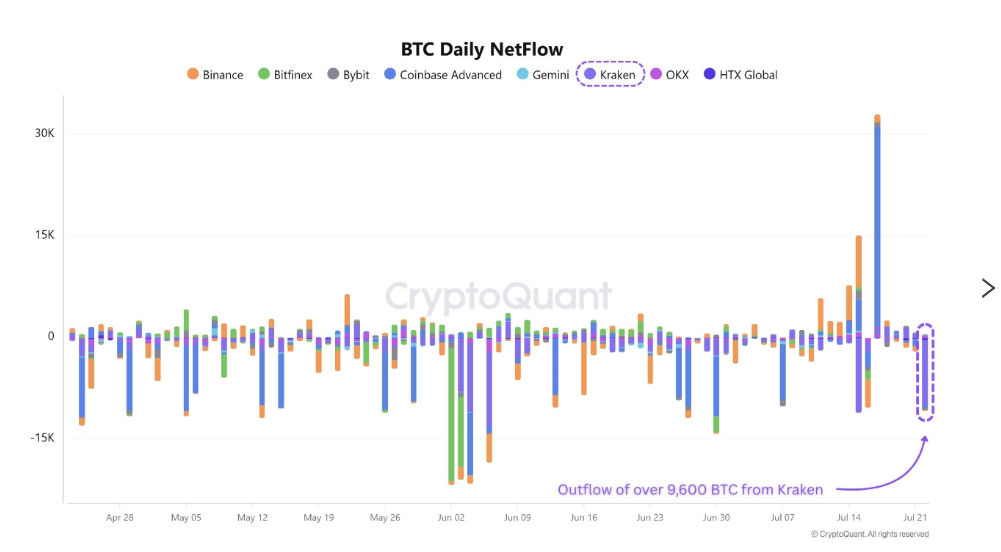
BTC daily netflow Kraken exchange chart. Source: CryptoQuant
Historically, retail investors have often exited their positions prematurely during bull markets, while large investors — commonly referred to as smart money — tend to capitalize on these moments by accumulating and holding through volatility for larger gains.
The Bitcoin Inter Exchange Flow Pulse (IFP) by balance indicator shows a longer and clearer picture. Despite Bitcoin's reaching its record high of $123,218 last week, the IFP shows a decline in Bitcoin flows to exchanges. This behavior suggests that investors, especially large ones, are not intending to sell at this stage.
When examining 2017 and 2021 bull runs, the metric showed a spike indicating selling activity from large wallets, which led to a crash in the BTC price. However, as of now, the metric is consolidating, suggesting that large investors are holding onto the market and that flows to exchanges are limited.
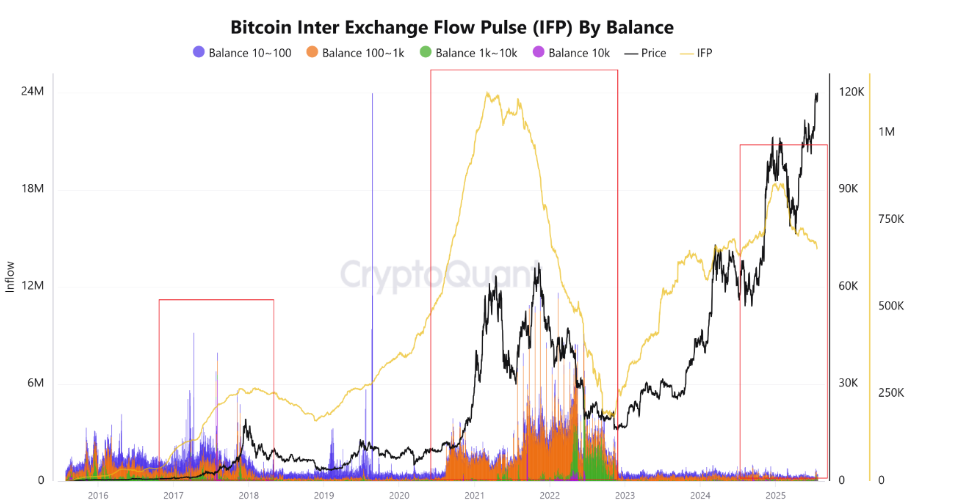
Bitcoin Inter Exchange Flow Pulse (IFP) by balance chart. Source: CryptoQuant
Bitcoin Price Forecast: BTC consolidates between $116,000 and $120,000
Bitcoin price has been trading broadly sideways between $116,000 and $120,000 after reaching a new all-time high of $123,218 on July 14. At the time of writing on Wednesday, it faces rejection from its upper consolidation band at $120,000.
If BTC falls below the lower consolidation boundary at $116,000 on a daily basis, it could extend the decline to retest the 50-day Exponential Moving Average (EMA) at $110,948.
The Relative Strength Index (RSI) on the daily chart reads 62, after rejecting its overbought conditions on Tuesday, indicating fading bullish momentum. The Moving Average Convergence Divergence (MACD) lines coil against each other, indicating indecisiveness among traders.
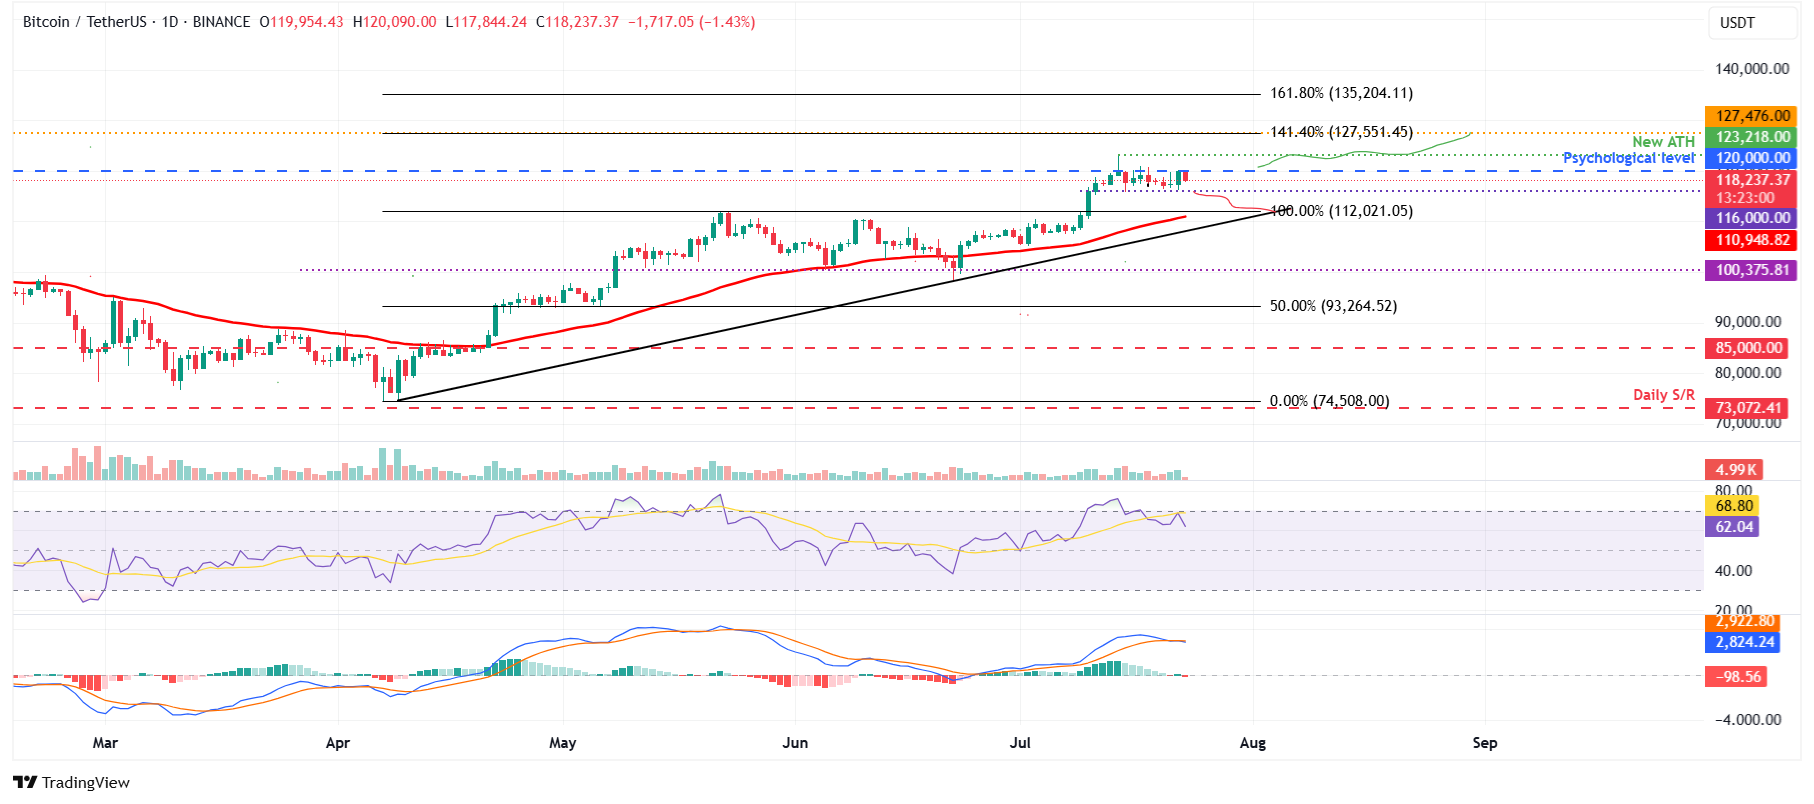
BTC/USDT daily chart
On the contrary, if BTC closes above the upper boundary of the consolidation range at $120,000 on a daily basis, it could extend the recovery toward the fresh all-time high at $123,218.
Bitcoin, altcoins, stablecoins FAQs
Bitcoin is the largest cryptocurrency by market capitalization, a virtual currency designed to serve as money. This form of payment cannot be controlled by any one person, group, or entity, which eliminates the need for third-party participation during financial transactions.
Altcoins are any cryptocurrency apart from Bitcoin, but some also regard Ethereum as a non-altcoin because it is from these two cryptocurrencies that forking happens. If this is true, then Litecoin is the first altcoin, forked from the Bitcoin protocol and, therefore, an “improved” version of it.
Stablecoins are cryptocurrencies designed to have a stable price, with their value backed by a reserve of the asset it represents. To achieve this, the value of any one stablecoin is pegged to a commodity or financial instrument, such as the US Dollar (USD), with its supply regulated by an algorithm or demand. The main goal of stablecoins is to provide an on/off-ramp for investors willing to trade and invest in cryptocurrencies. Stablecoins also allow investors to store value since cryptocurrencies, in general, are subject to volatility.
Bitcoin dominance is the ratio of Bitcoin's market capitalization to the total market capitalization of all cryptocurrencies combined. It provides a clear picture of Bitcoin’s interest among investors. A high BTC dominance typically happens before and during a bull run, in which investors resort to investing in relatively stable and high market capitalization cryptocurrency like Bitcoin. A drop in BTC dominance usually means that investors are moving their capital and/or profits to altcoins in a quest for higher returns, which usually triggers an explosion of altcoin rallies.
Author

Manish Chhetri
FXStreet
Manish Chhetri is a crypto specialist with over four years of experience in the cryptocurrency industry.


